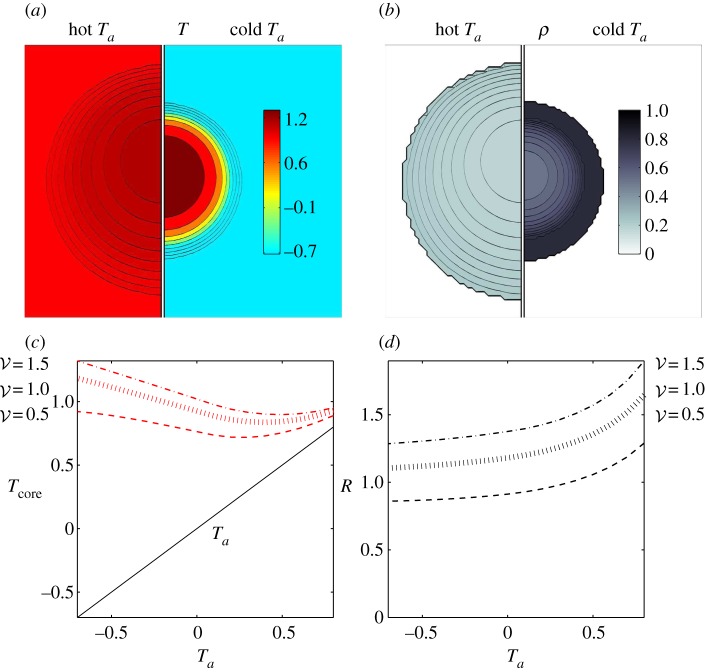
Figure 3.
Adaptation with temperature-independent metabolism. (a) Comparison of temperature and packing fraction profiles at high (0.8) and low (–0.7) ambient temperature, where the dimensionless total bee volume 𝒱 is 1. (b) Core temperature as a function of ambient temperature and total bee volume shows that as 𝒱 increases the core temperature increases but adaptation persists over a range of Ta (also plotted to guide the eye.) (c) Cluster radius as a function of ambient temperature and total bee volume showing how clusters swell with temperature, consistent with experiment. For bee packing fraction, we choose coefficients of ρ0 = 0.85, c0 = 0.45, c1 = 0.3, ρmax = 0.8. For heat transfer, we choose coefficients of k0 = 0.2, κ0 = 1. (Online version in colour.)

