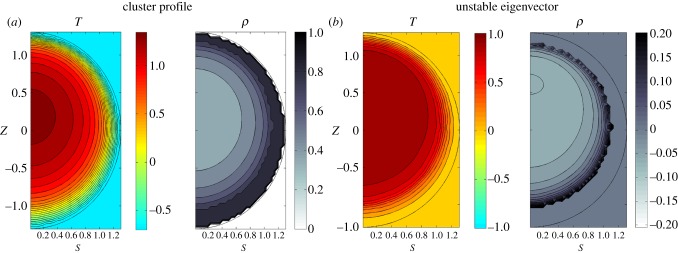
Figure 8.

(a) Cluster profile. (b) Contour plots of unstable eigenvector of linear response matrix. Circle represents boundaries of the cluster, and a temperature-dependent metabolic rate is used. J0 = 1, 𝒱 = 1.5, Ta = −0.7. ρ0 = 0.85, c0 = 0.5, c1 = 0.25, ρmax = 0.8. For heat transfer, we choose coefficients of k0 = 0.4, κ0 = 2. Note that the packing fraction very close to the boundary is fixed because ρ = ρmax. (Online version in colour.)
