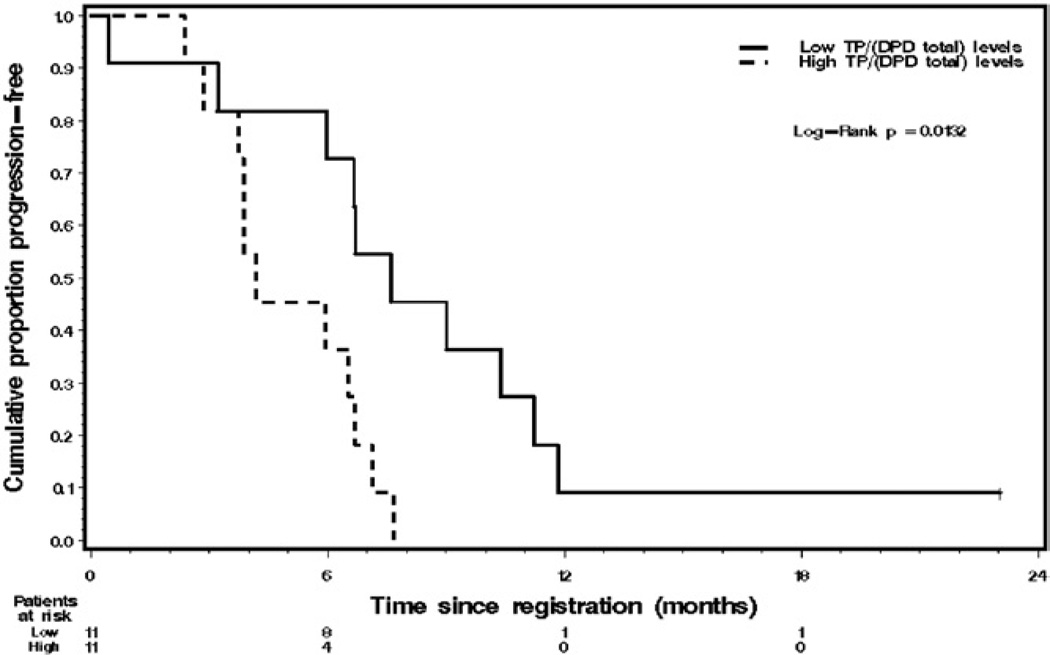
Figure 3.
Kaplan-Meier graph reveals TTP in 22 patients with metastatic AIPC by median dichotomized tumor tissue TP/DPD ratio. Tick mark represents 1 censored survivor who was progression free. Low, 0.58 or less. High, greater than 0.58. TTP differed significantly between these 2 subgroups (log rank test p = 0.0132).

