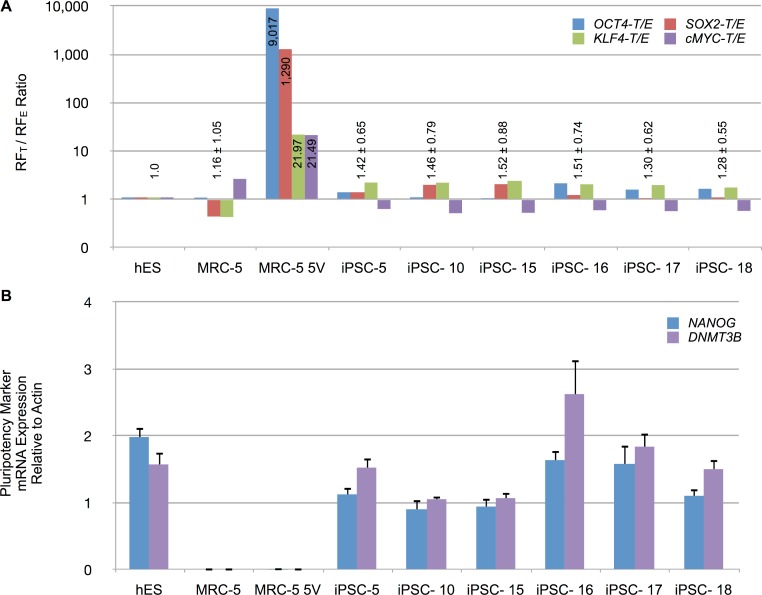
Figure 7. Reprogramming factor and pluripotency related mRNA expression in putative iPSC clones.
(A) The RFT to RFE ratio, determined by RT-qPCR of total RNA isolated from indicated cell types, is shown for untransduced MRC-5 fibroblasts, vector-transduced MRC-5 fibroblasts (MRC-5 5V) and derived iPSC clones. The RFT/RFE ratios were normalized to that observed in hES cells. Mean ± standard deviation of the combined RFT/RFE ratios of all four RFs are shown above the bars, except for MRC-5 5V where the individual RFT/RFE ratio, while significantly different from hES, also varied significantly between the RFs. (B) Expression of NANOG and DNA methyltransferase 3B (DNMT3B) in hES cells, untransduced MRC-5 and transduced MRC-5 (MRC-5 5V), and derived iPSC clones. The mRNA expression was normalized to β-actin levels in the samples. Error bar represents one standard deviation. The standard deviation of the ratio of means was calculated as described under Materials and Methods.

