
Figure 4.
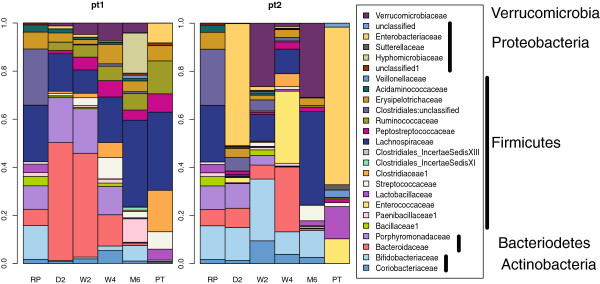
Barplot of abundance at the family level. Operational taxonomic units (OTUs) that comprised more than 0.5% of the OTUs in any sample were grouped into the appropriate family and plotted. These plots show how the actual composition of each sample changes over time. Note that the two patients had very different initial microbiota compositions. The compositional differences were maintained at all time points, suggesting that environmental or genetic factors were important in shaping community structure