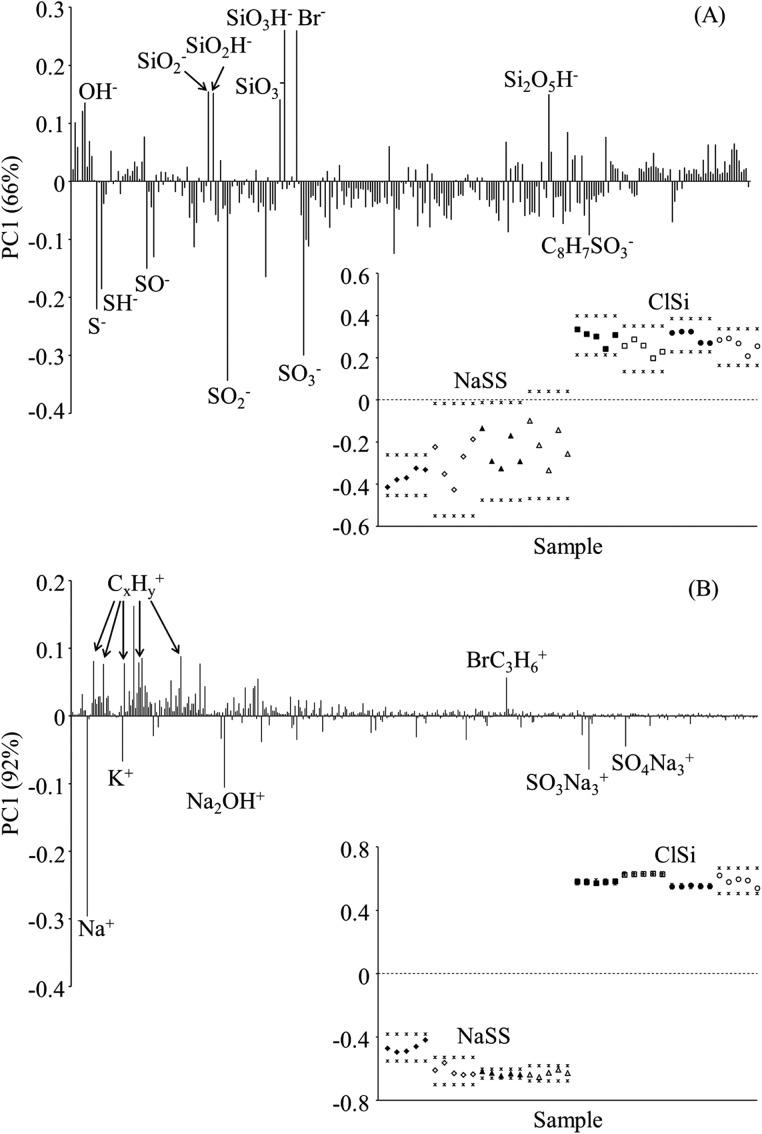
Figure 4.
ToF-SIMS PCA loadings plots with inset scores plots for negative (a) and positive (b) secondary ion spectra. (♦) and (▲) designate NaSS on Ti and Si, respectively; (▪) and (●) designate ClSi and Ti and Si, respectively. Open symbols designate measurements on replicate samples. (*) designate the 95% confidence intervals.

