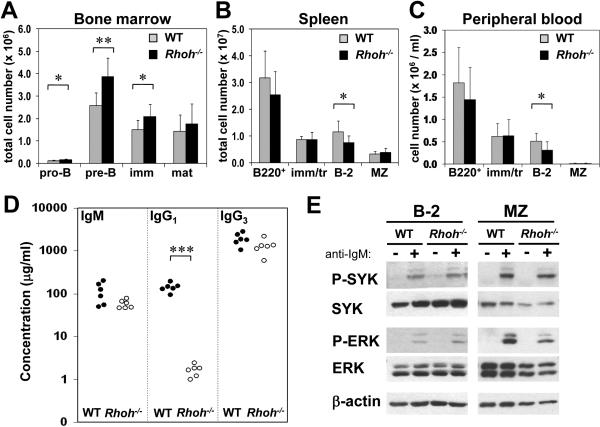
Figure 1. B cell subsets in WT and Rhoh−/− mice.
Analysis was by multiparameter flow cytometry, and absolute cell numbers were calculated using the total cellularity of each organ. (A) B cell differentiation stages in the bone marrow. (B, C) B cell numbers (B220+) and subsets in the spleen and peripheral blood. Data represent mean ± standard deviation. N=9 mice/analysis. * indicates p<0.05; **, p<0.005. (D) Serum concentrations of IgM, IgG1 and IgG3 in WT and Rhoh−/− mice, determined by ELISA. N=6 mice/genotype. * indicates p<0.001. The differences in IgM and IgG3 were close to statistical significance (p=0.07 and 0.09, respectively. Note logarithmic scale in the y-axis). (E) Analysis of BCR signaling. Sorted populations of B-2 and MZ B cells were stimulated with 25 μg/ml anti-IgM for 1 min and analyzed by immunoblotting for SYK and ERK phosphorylation. WT, wild-type; imm, immature B cells; mat, mature B cells; tr, transitional B cells; MZ, marginal zone B cells.

