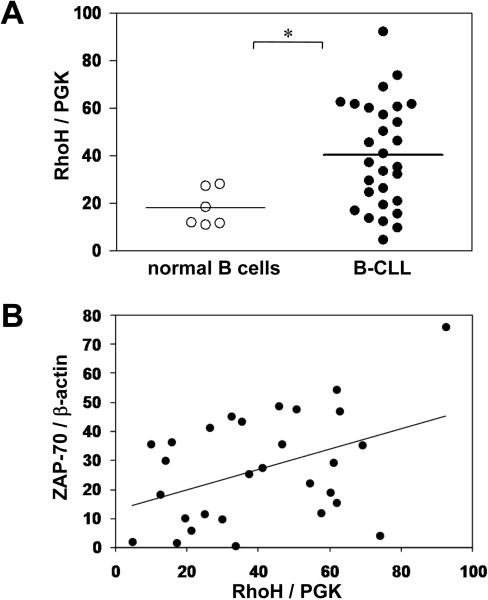
Figure 2. RhoH expression in human CLL.
(A) The ratio of RhoH to PGK1 mRNA levels, measured by quantitative real-time PCR, is shown for primary human CLL cells and for peripheral blood B-cells from healthy donors. Dots represent individual patients. Horizontal bar represents the mean. * indicates p<0.05, normal vs. CLL cells. (B) Correlation between RhoH and ZAP70 expression in primary human CLL cells. ZAP70 protein expression was determined by immunoblotting and the densitometry readout of the ZAP70 bands was normalized with that of β-actin. RhoH mRNA expression was measured by quantitative real-time PCR and normalized with PGK expression. A calibrator sample was used to allow normalization across different PCR plates and western blot membranes. Pearson correlation, r=0.42, p<0.05.

