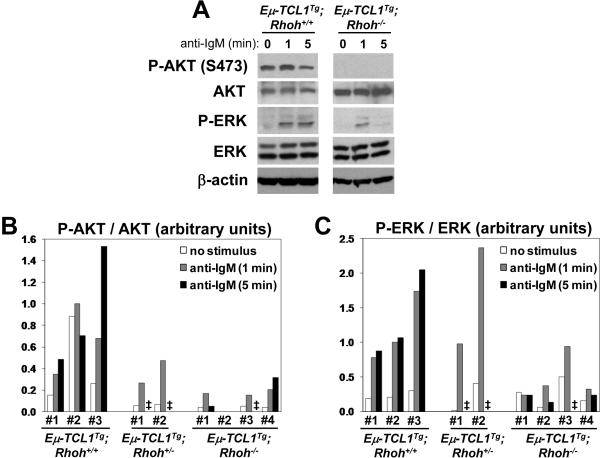
Figure 4. Impaired BCR-induced AKT phosphorylation in Eμ-TCL1Tg;Rhoh−/− splenocytes.
(A) Analysis of BCR signaling in splenocytes from Eμ-TCL1Tg;Rhoh+/+ and Eμ-TCL1Tg;Rhoh−/− mice. Cells were stimulated with 25 μg/ml anti-IgM for 1 or 5 min and analyzed by immunoblotting. (B) Densitometric quantification of AKT (Ser473) phosphorylation in splenocytes from Eμ-TCL1Tg;Rhoh+/+ (n=3), Eμ-TCL1Tg;Rhoh+/− (n=2) and Eμ-TCL1Tg;Rhoh−/− mice (n=4). Values were normalized with total AKT expression. (C) Densitometric quantification of ERK (Thr202/Tyr204) phosphorylation in splenocytes from Eμ-TCL1Tg;Rhoh+/+ (n=3), Eμ-TCL1Tg;Rhoh+/− (n=2) and Eμ-TCL1Tg;Rhoh−/− mice (n=4). Values were normalized with total ERK expression. In (B) and (C), one of the samples was used as a calibrator to allow normalization across different gels. ‡, not determined.

