
Figure 1.
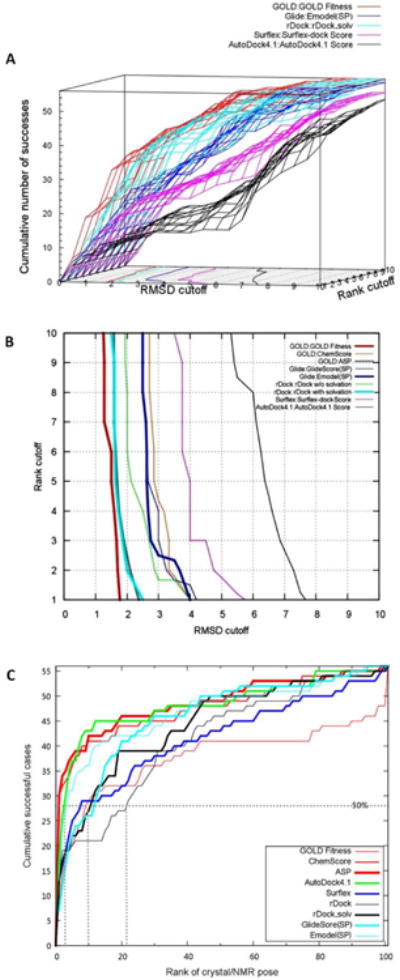
The 3D cumulative success rate from the binding mode reproduction experiments. (A). The cumulative success rate in 3D representation was calculated based on a series of C(X, YÅ). Only scoring functions which obtained the highest VUS values for each docking program were selected for illustration. The contour on the XY (RMSD-Rank) plane represented the 50% (Z=28) success rate (the binding mode can be reproduced for 50% of RNA-ligand complexes); (B). The 50% success contour (Z=28) for all available scoring functions (GlideScore (XP) and Emodel (XP) were not included due to the unavailability of VUS values). (C). The cumulative success rate for 56 RNA-ligand complexes based on the ranking of X-ray/NMR determined poses against 100 decoys. The 50% success line and the corresponding rankings to achieve 50% success were shown as dots.