
Figure 4.
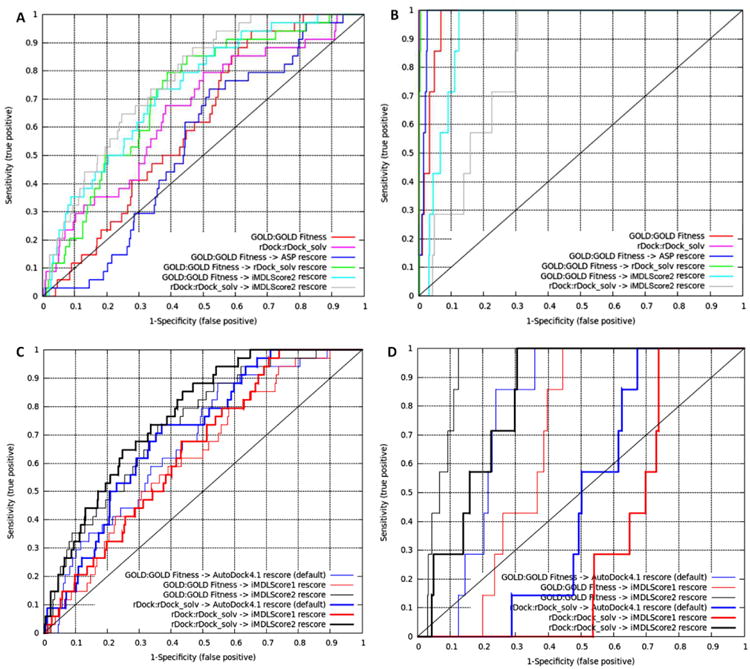
ROC curves of the virtual screening experiments with various docking/scoring combinations. (A). Virtual screening against the 16S rRNA A-site using the Foloppe dataset. (B). Virtual screening against the lysine riboswitch using 7 known active compounds. (C-D). ROC comparison of the virtual screening performances of AutoDock4.1 and iMDLScore1/iMDLScore2 scoring functions with rRNA A-site (C). and lysine riboswitch (D). GOLD:GOLD Fitness dockings were in thin lines, while rDock:rDock_solv dockings were in thick lines. AutoDock4.1 default scoring function, iMDLScore1 and iMDLScore2 were colored red, blue and black, respectively.