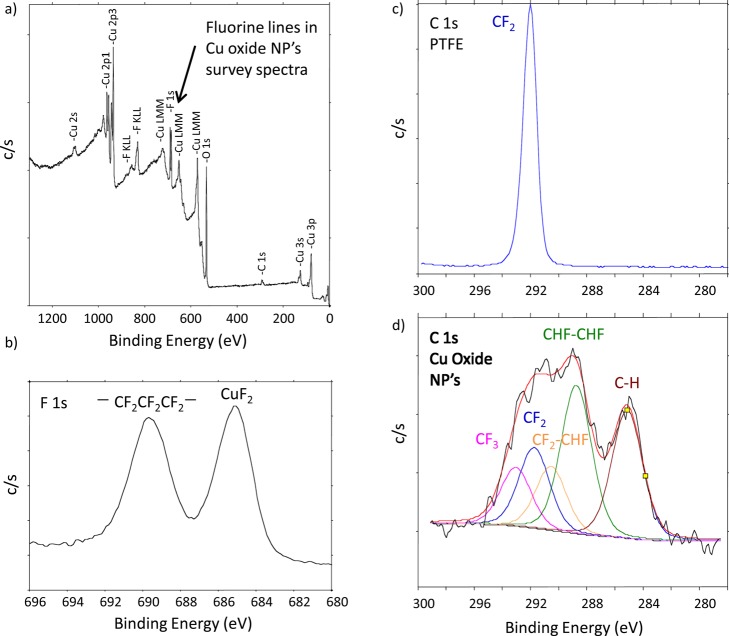
Figure 6.
(Color online) XPS spectra from Cu oxide nanoparticles and clean PTFE reference: (a) XPS survey spectra with unexpected F lines; (b) High-energy resolution F 1s region, showing photoelectron peaks consistent with the presence of PTFE and CuF2; (c) High-energy resolution spectrum C 1s region from clean PTFE, showing a photoelectron peak consistent with CF2 bonds in PTFE; and d) High-energy resolution C 1s, showing the presence of breakdown products from PTFE (e.g., CF3, CF2, CF2-CHF, CHF-CHF, along with CH from advantageous surface contamination; a small amount of C-O and C = O is possible but not included in this peak fit). XPS identified the presence of F that was not expected or desired on these particles.

