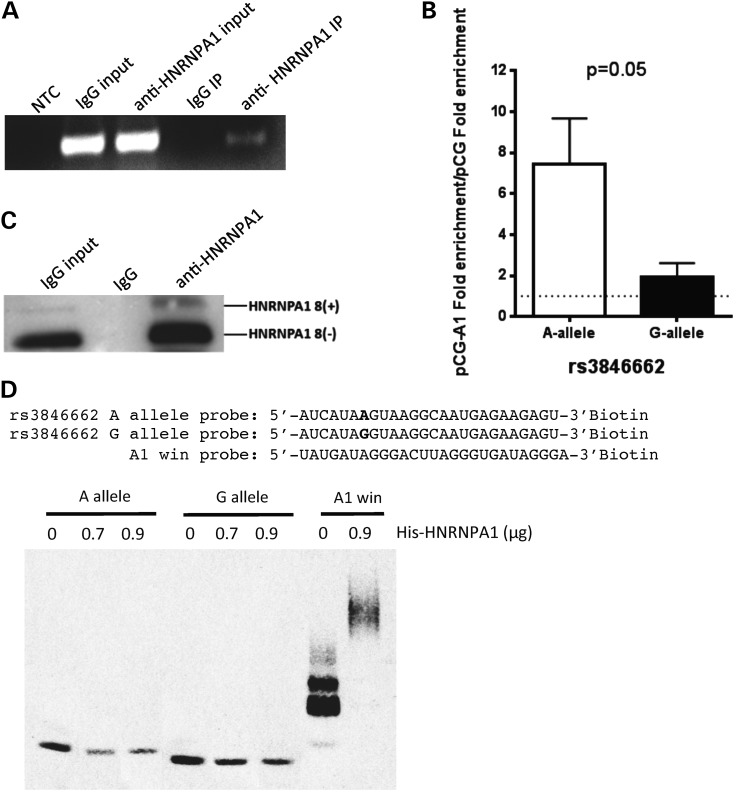
Figure 4.
HNRNPA1 directly interacts with HMGCR intron 13. (A) HepG2 cell lysates were subject to RIP using an anti-HNRNPA1 antibody or normal mouse IgG as control. HMGCR intron 13 containing transcripts in the input and immunprecipitated (IP) RNA was detected by RT-PCR, and visualized on a 2% agarose gel along with PCR negative control (NTC). (B) HepG2 cells (n = 3) were co-transfected with either the rs3846662 ‘A’ allele or ‘G’ allele HMGCR mini-gene construct as well as either the pCG-A1 HNRNPA1 8(−) overexpression or pCG control plasmid. After 48 h, an RIP assay was performed, and the pull-down mHMGCR pre-mRNA was analyzed by qPCR. The fold enrichment of binding was calculated as the amount of mini-gene HMGCR obtained from the anti-HNRNPA1 antibody-immunoprecipitates compared with the quantity of mini-gene HMGCR isolated from the normal mouse IgG complexes (negative control). Values shown are mean ± standard error. (C) Cell lysates from the RIP assays were subject to western blot analysis with anti-human HNRNPA1 antibody to confirm HNRNPA1 protein pull-down. (D) RNA gel shift assay was performed to test whether rs3846662 modulates the direct interaction between HNRNPA1 protein (His-HNRNPA1) and HMGCR intron 13. The upper panel shows the sequences of 3′ biotin-labeled rs3846662 RNA probes containing either ‘A’ or ‘G’ allele. The A1 win probe is a positive control probe containing three repeats of a known HNRNPA1-binding motif (15). Each of the three RNA probes was incubated with varying concentrations of His-HNRNPA1 protein, with reactions separated onto a 4–20% gel, transferred to a membrane, cross-linked and band intensity quantified. Although no shift was observed with the HMGCR probes, complex formation was inferred by the decrease in free RNA probe as RNA–protein complexes may have been trapped in the gel wells. The experiment was performed in triplicate, with a representative gel shown. See also Supplementary Material, Figure S2.

