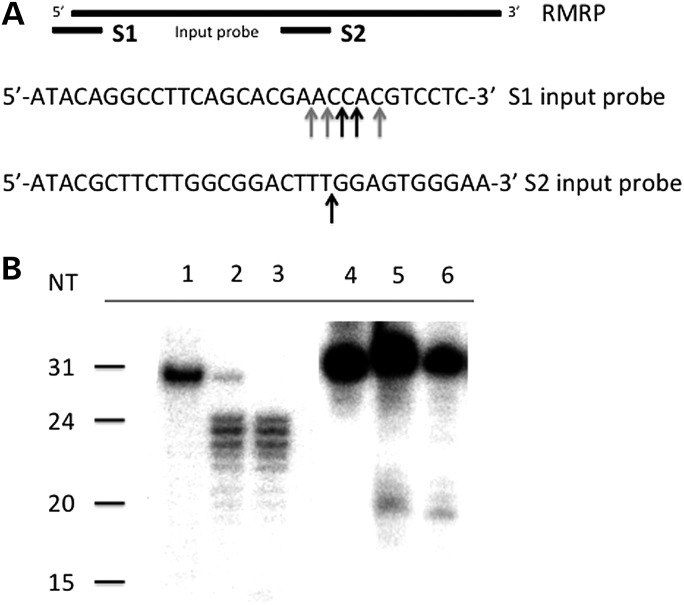
Figure 2.
Mapping of 5′ ends of RMRP-S1 and -S2. (A) Top lines, locations of input probes S1 and S2 on the full-length RMRP gene (left–right 5′–3′). Sequences of the S1 and S2 input probes below the map. Arrows denote locations of transcript start sites determined by S1 nuclease protection shown in (B). Black arrows, equal strongest bands; gray arrows, less strong bands. (B) S1 nuclease protection assay results. Lane 1: input probe for RMRP-S1; Lanes 2 and 3: protected fragments in two different cirrhotic liver RNAs. Lane 4: input probe for RMRP-S2; Lanes 5 and 6: protected fragments in two cirrhotic liver RNAs.

