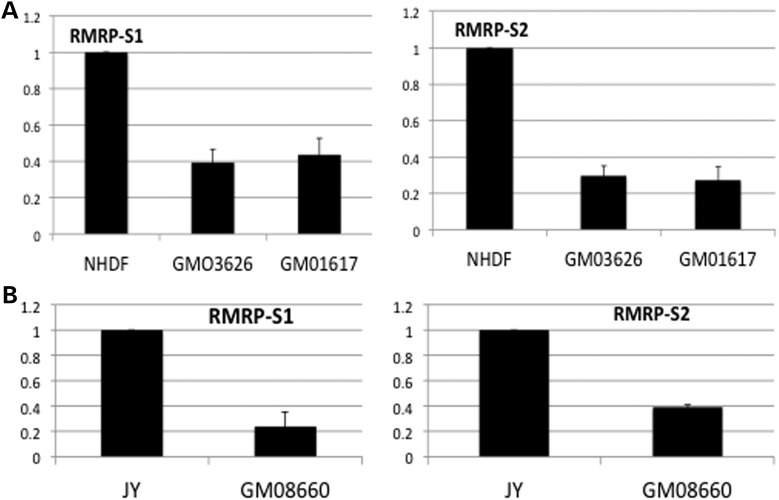
Figure 7.
(A) Primary fibroblasts isolated from CHH patients express significantly lower levels of RMRP-S1 and RMRP-S2 compared with NHDF. Taqman assays specifically detecting RMRP-S1 (left) or RMRP-S2 (right). (NHDF) total RNA isolated from primary NHDF and (GMO3626 and GMO1617) two independent of primary fibroblast isolations from CHH patients with homozygous 70A>G mutation. Data were normalized using miR-16 expression, and the fold difference was calculated using NHDF as normalization control = 1. Fold difference = 2(−ddCt) + _SEM. (n = 9 for each determination). Error bars = ±SEM. (B) EBV-immortalized B cells from a CHH patient express reduced levels of RMRP-S1 and RMRP-S2 compared with normal JY-immortalized B cells. Quantitative analysis of RMRP-S1 (left) and RMRP-S2 (right) in CHH-immortalized B cells, GM08660 (156G>C) compared with JY EBV-immortalized B lymphoblastoid cells, assayed by custom TaqMan assays. Data were normalized using miR-16 expression, and the fold difference was calculated using JY cells as control. Fold difference = 2(−ddCt) + _SEM. (n = 9 for each determination).

