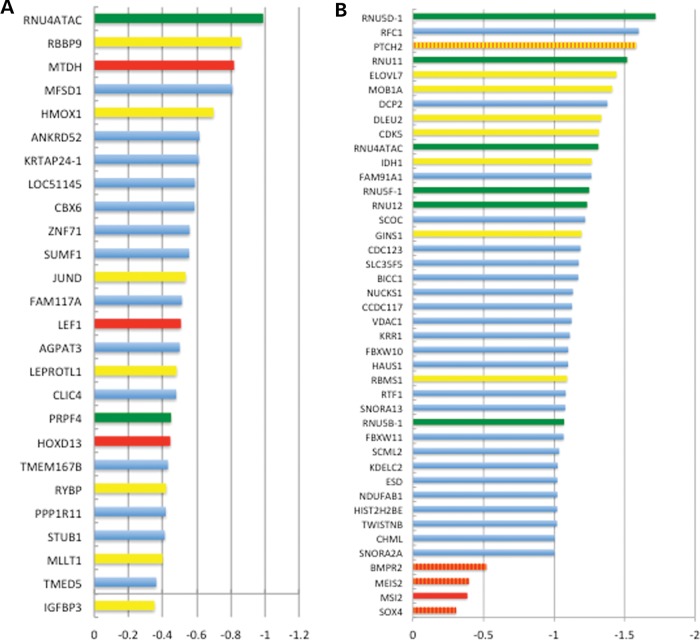
Figure 9.
Bar graphs depicting the most highly down-regulated genes by RMRP-S1 (A) and RMRP-S2 (B). Colored bars denote genes in enriched categories according to IPA. Red bars: hematopoietic genes; green bars: splicing genes; yellow bars: growth and proliferation genes; orange bars: bone growth and development genes. Blue bars: varied functional categories including transcription factors, tumor suppressors and other structural and regulatory genes. Yellow/orange striped bar: bone growth and proliferation. Orange and red striped bar: bone growth and hematopoietic gene.

