. 2013 Dec 24;2:e01119. doi: 10.7554/eLife.01119

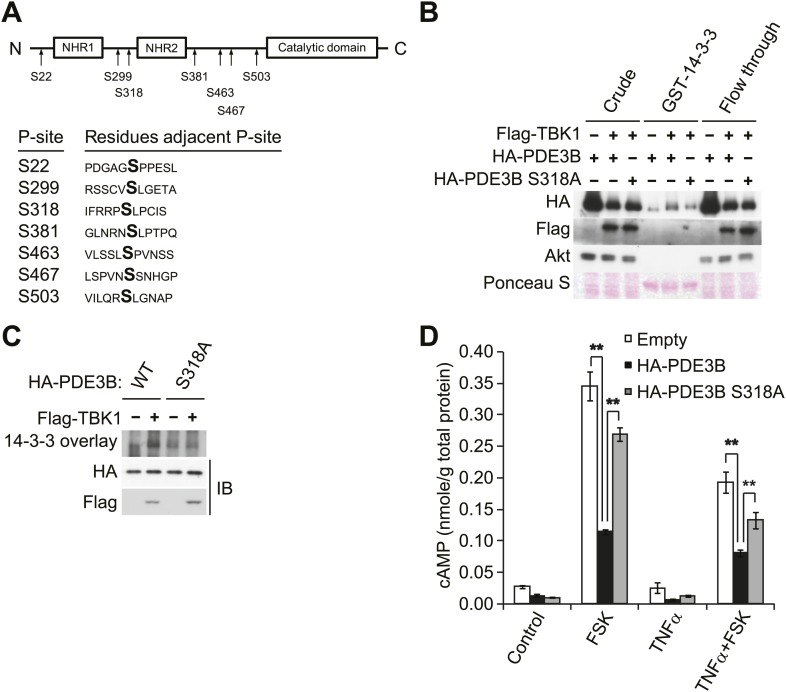
Figure 4. IKKε and TBK1 phosphorylate PDE3B at serine 318, resulting in the binding of 14-3-3β.

(A) Summary of sites on PDE3B phosphorylated by IKKε or TBK1 (P-sites) from mass spectrometry experiments. (B) Immunoblots of GST-14-3-3 pulldown from HEK293T cells co-expressing HA-PDE3B or HA-PDE3B S318A with Flag-TBK1. Ponceau S staining shows the amount of beads used in GST-14-3-3 pulldown. Results were replicated in multiple experiments. (C) GST-14-3-3 overlay on nitrocellulose membrane (top blot) and an immunoblot (IB) of whole cell lysates from HEK293T cells co-expressing HA-PDE3B or HA-PDE3B S318A with Flag-TBK1 (bottom blot). Results were replicated in multiple experiments. (D) cAMP levels from 3T3-L1 adipocytes expressing empty vector, HA-PDE3B, or HA-PDE3B S318A treated with or without 100 ng/ml TNFα for 16 hr followed by treatment with or without 25 μM FSK for 15 min. **p<0.0001 and **p<0.01. Performed in duplicate.

DOI: http://dx.doi.org/10.7554/eLife.01119.009

Figure 4.

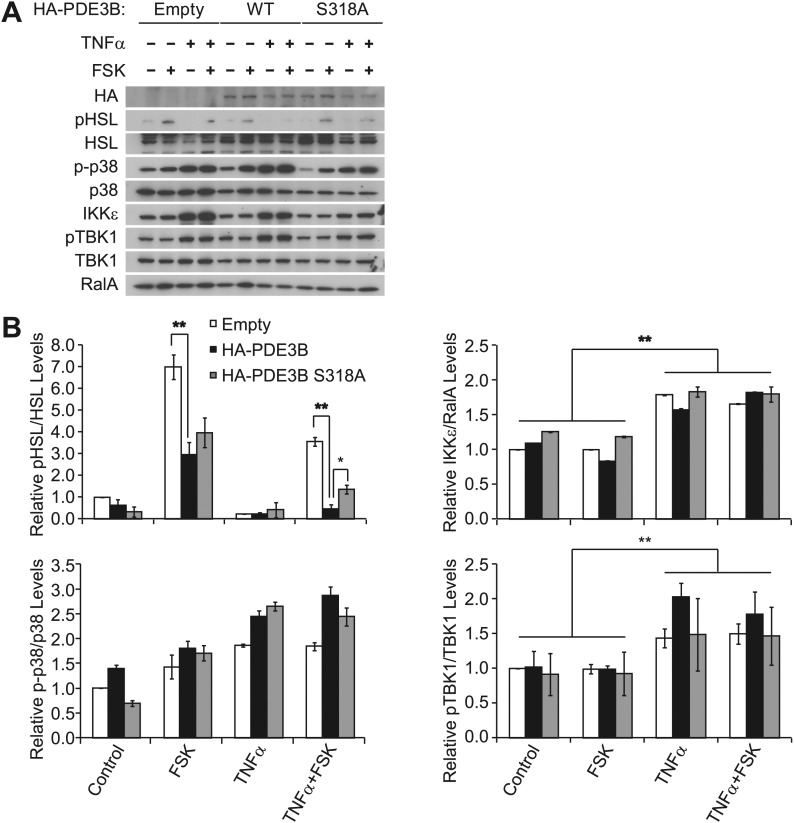
Figure 4—figure supplement 1. Overexpression of PDE3B in 3T3-L1 adipocytes reduces the attenuation of forskolin-stimulated β-adrenergic signaling produced by TNFα.

Figure 4—figure supplement 1.

(A) Immunoblots of whole cell lysates from Figure 4D. (B) Top left panel, pHSL and total HSL signals in whole cell lysates were quantified and normalized to the basal signal (lane 1 in Figure 4—figure supplement 1A). The normalized pHSL/total HSL ratio is presented as the mean ± SEM of two independent experiments. **p<0.0001 and *p<0.05. Top right panel, quantification of total IKKε and RalA signals in whole cell lysates was performed as described above. **p<0.0001. Bottom left panel, quantification of phospho-p38 (p-p38) and total p38 signals in whole cell lysates was performed as described above. Bottom right panel, quantification of pTBK1 and total TBK1 signals in whole cell lysated was performed as described above. **p<0.01.