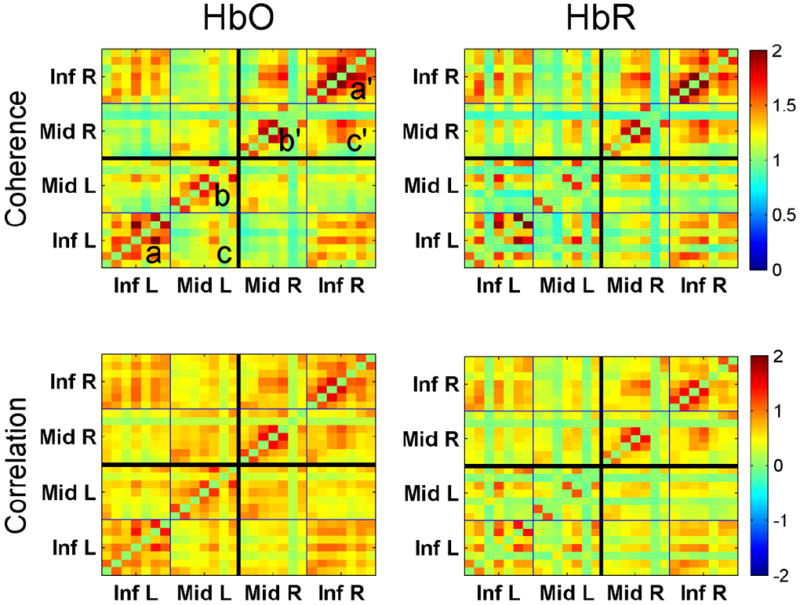
Fig 3.

Group average connectivity matrices showing pairwise z-coherences (top panels) and correlations (bottom panels) for all channels. Coherence/correlation between channels v1 and v2 is represented by color at point with x-coordinate = v1 and y-coordinate = v2. Inf L and Inf R are left/right IFG, Mid L and Mid R are left/right MFG. Matrices are symmetrical along the main diagonal from bottom-left to top-right.
