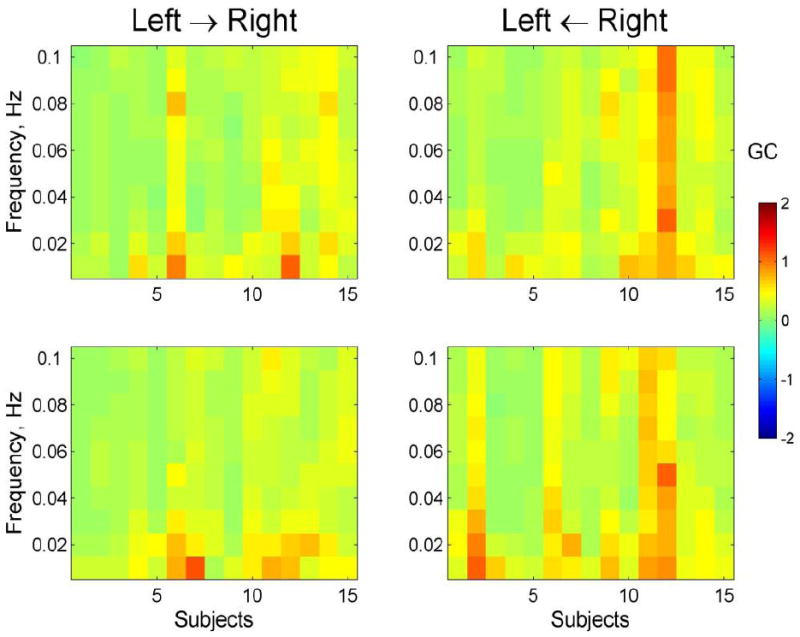
Fig 5.

Granger Causality (GC) calculated for interhemispheric relationships (between homologous areas in left and right hemispheres) for frequencies 0.01-0.1 Hz. The graphs represent the GC matrices averaged over all 14 left-right channel pairs for each subject. Panels represent directed Granger causalities namely, from the left hemisphere to the right hemisphere (panels titled ‘Left → Right’) as well as in the opposite direction from the right hemisphere to the left (panels titled ‘Left ← Right’). Granger causality is a directed measure which allows for a separate analysis of how much signal 2 is dependent on signal 1 (1 → 2) as well as how much signal 1 is dependent on signal 2 (1 ← 2). Note a similar pattern of causality over all frequencies with slightly higher GC values at low frequencies 0.01-0.03 Hz.
