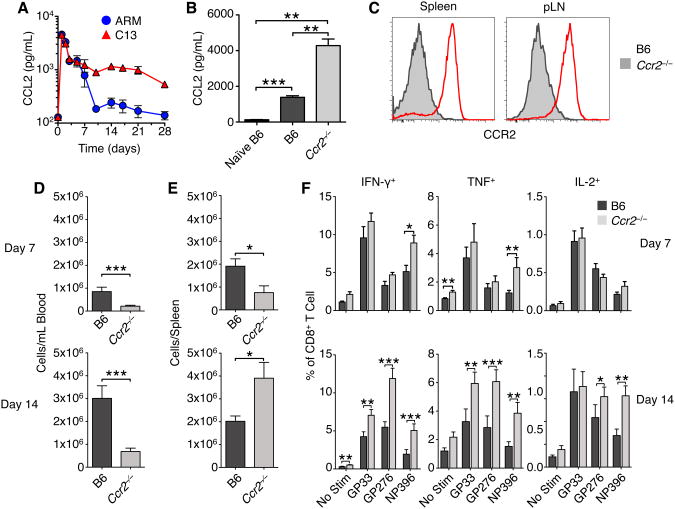
Figure 6. See also Figure S3: CCR2-deficient mice have enhanced T cell responses to C13.
(A) Serum concentrations of CCL2 were measured during ARM and C13 infection. Serum cytokine concentrations are presented as mean ± SEM from ≥3 mice per group.
(B) Serum concentrations of CCL2 in WT and Ccr2−/− mice day 14 post C13 infection. Serum cytokine concentrations are presented as mean ± SEM from ≥3 mice per group.
(C) Representative flow cytometry CCR2 staining on monocytic cells from WT and Ccr2−/− mice day 14 post C13 infection.
(D) Blood and spleen (E) levels of monocytic cells on days 7 and 14 post C13 infection were determined by flow cytometry. Data are represented as mean ± SEM of 3-5 experiments, each with 4-6 mice per group.
(F) Spleen CD8+ T cell cytokine production following stimulation with indicated LCMV peptides day 7 and day 14 p.i. Data are represented as mean ± SEM of 3-4 experiments, each with ≥4 mice per group.
*p<0.05, **p<0.01, ***p<0.001.

