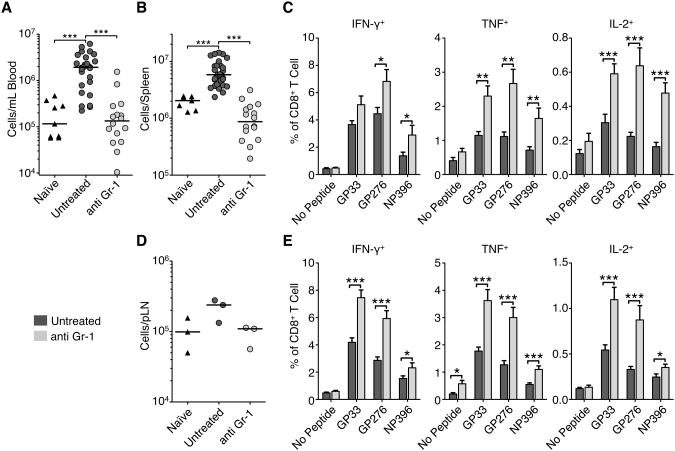
Figure 7. see also Figure S4: Depletion of myeloid cells enhanced LCMV-specific T cell cytokine responses.
C13 infected mice received 100μg anti-Gr-1 (RB6-8C5) or isotype control antibody per day starting day 11 p.i. (A) Total myeloid cells (CD11b+ CD11clo/−) in the blood and spleen (B) were measured by flow cytometry on day 14 p.i. Data are individual mice from 3 independent experiments and the bar represents the median.
(C) Frequency of cytokine production in spleen CD8+ T cells following stimulation of splenocytes with indicated LCMV peptides for 5hr and intracellular flow cytometry cytokine staining. Data are represented as mean ± SEM from at least 3 experiments with ≥5 mice per group.
(D) Total myeloid cells in the pooled total pLN. Data are averages of total pLN from 3 mice in 3 independent experiments and the bar represents the median.
(E) Frequency of cytokine production in pLN CD8+ T cells following stimulation with indicated LCMV peptides for 5hr and intracellular flow cytometry cytokine staining. Data are represented as mean ± SEM from 3 experiments with ≥5 mice per group. *p<0.05, **p<0.01, ***p<0.001.

