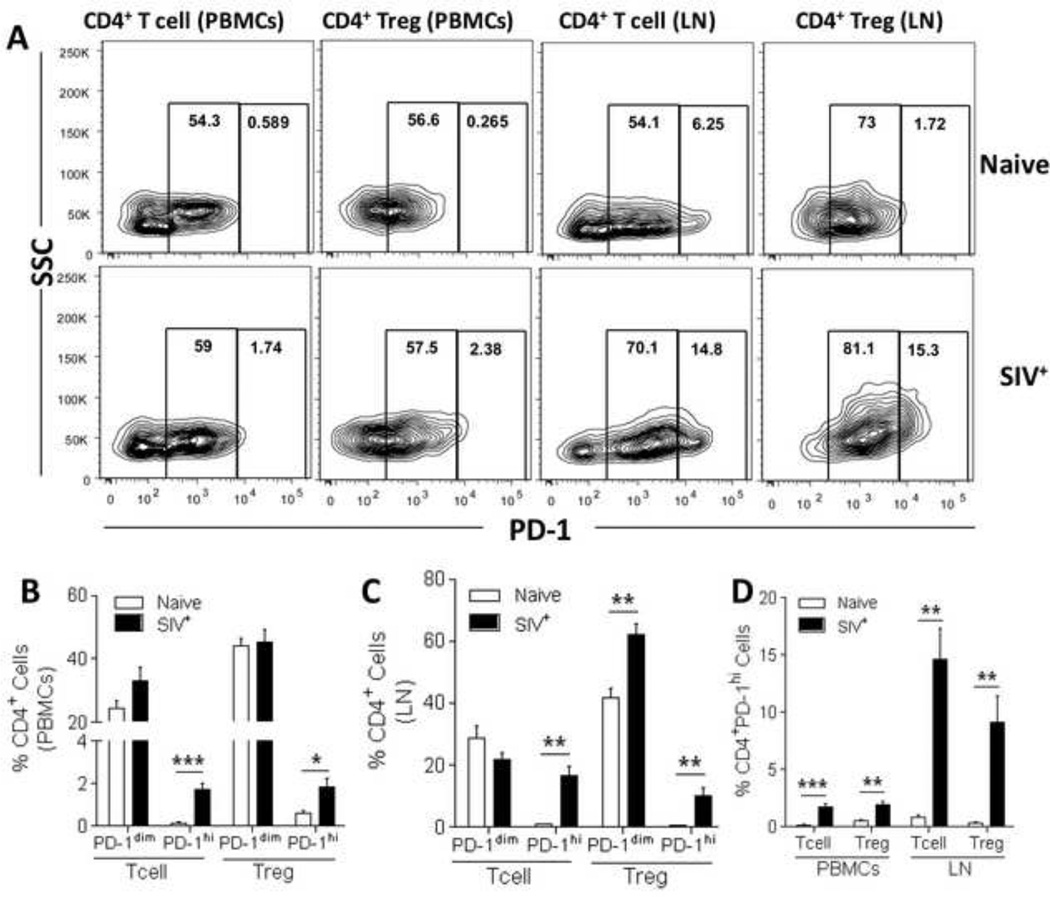
Figure 2. Proportional distribution of PD-1dim and PD-1hi T cells and Tregs in PBMCs and LN cells of naïve and SIV-infected macaques.
(A) PD-1 positive T cells and Tregs display a bi-modal expression pattern both in PBMCs as well as in lymph nodes. (B–D) Freshly isolated PBMC and LN single-cell suspensions from naïve and SIV-infected rhesus macaques were stained for analysis of PD-1 expression. Percentages of CD4+ PD-1dim and PD-1hi T cells and Tregs in PBMCs (B) and LN (C) cells. (D) Comparative representation of percentages of PD-1hi CD4+ T cells and Tregs in PBMCs and LN cells. Data are representative (A) or pooled (B–D) from at least 5 naïve and 12 SIV-infected macaques. Data are shown as means ± SEM. *, p<0.05, **, p<0.01, and ***, p<0.001 indicate statistically significant differences between the compared groups by Mann-Whitney Test.

