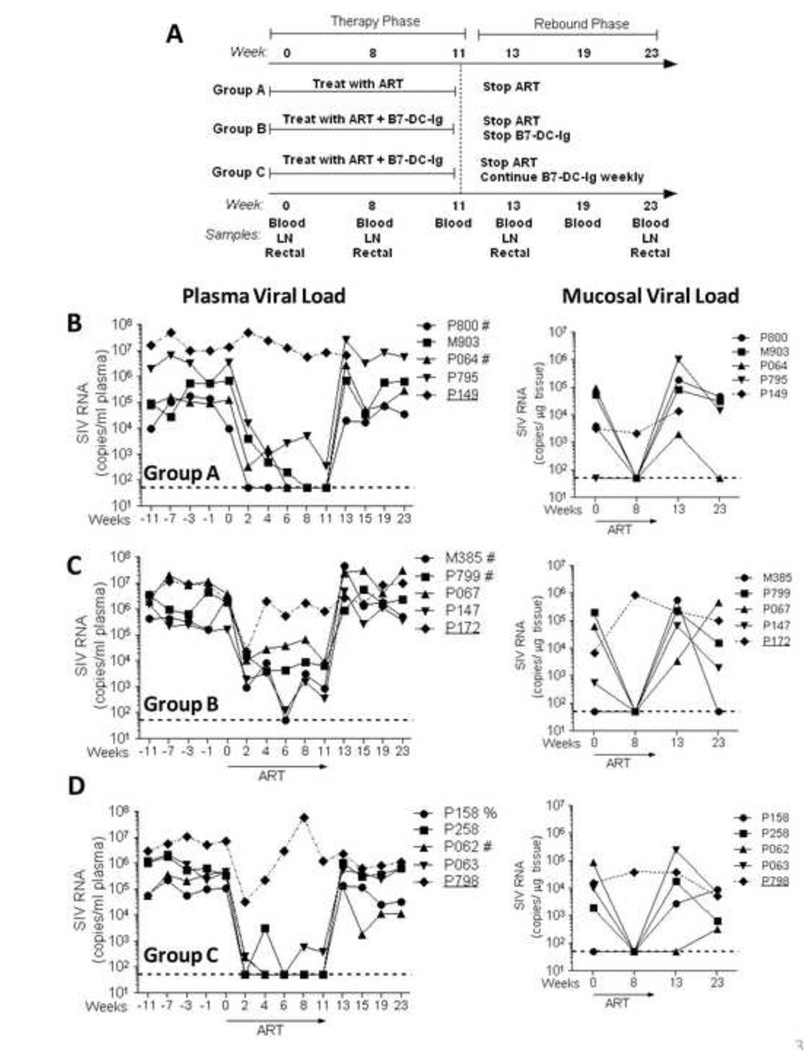
Figure 3. Therapeutic study design and plasma and rectal tissue viral loads for individual animals throughout the study.
(A) Schematic description of the study design indicating the experimental groups as well as the treatment administered in each group. Time points (in weeks) for sample collection as well as type of samples collected are indicated. (B–D) Plasma and rectal tissue viral loads were obtained at the indicated time points by NASBA. Dotted lines in B–D indicate the lower limit of viremia detection (50 copies) by NASBA. Viral loads in Group A (ART-only controls) were previously reported in (35). Animals P149 (Group A), P172 (Group B) and P798 (Group C) did not respond satisfactorily to ART and were not included in further analyses. #, Mamu A*01 positive; %, Mamu B*08 positive.

