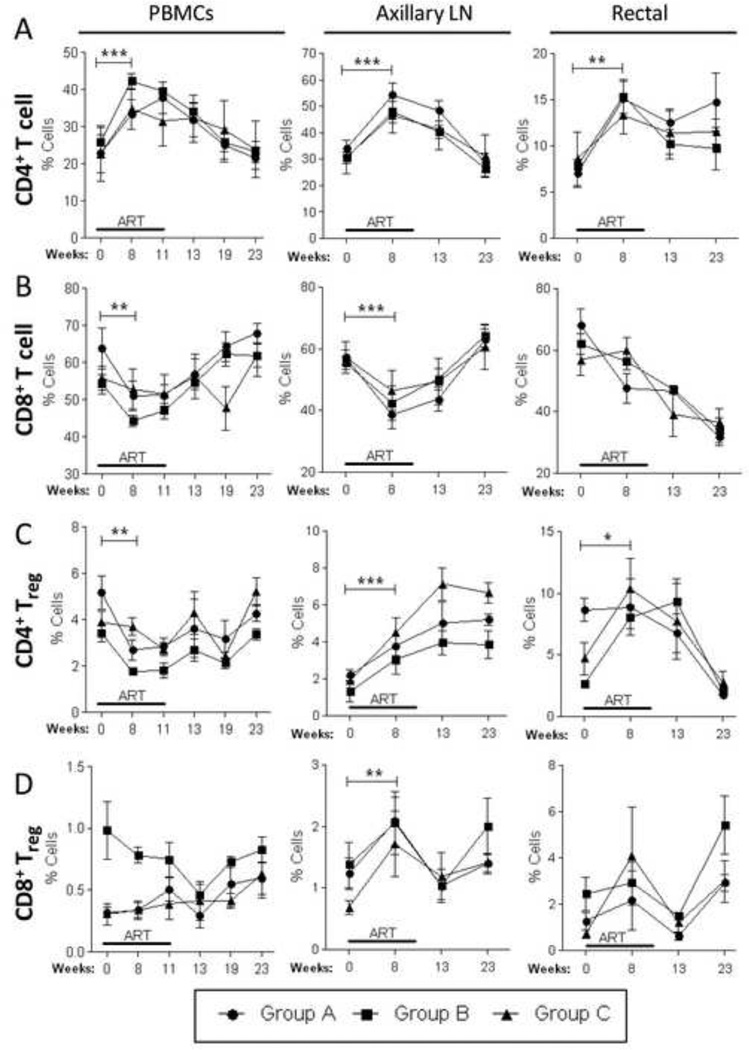
Figure 5. Proportional and compartmental distribution of CD4 and CD8 T cells and Tregs over the course of the study.
Blood, LN and rectal tissue samples (n=4 per group) were collected at different time points as indicated in Fig. 3A and stained for flow cytometric determination of T cell and Treg percentages. Proportional counts of CD4+ (A) and CD8+ (B) T cells, as well as, CD4+ (C) and CD8+ (D) Tregs were done at each indicated time point for each tissue. Data are shown as means ± SEM. *, p<0.05, **, p<0.01, and ***, p<0.001 indicate statistically significant differences between the indicated time points by the Wilcoxon signed rank test.

