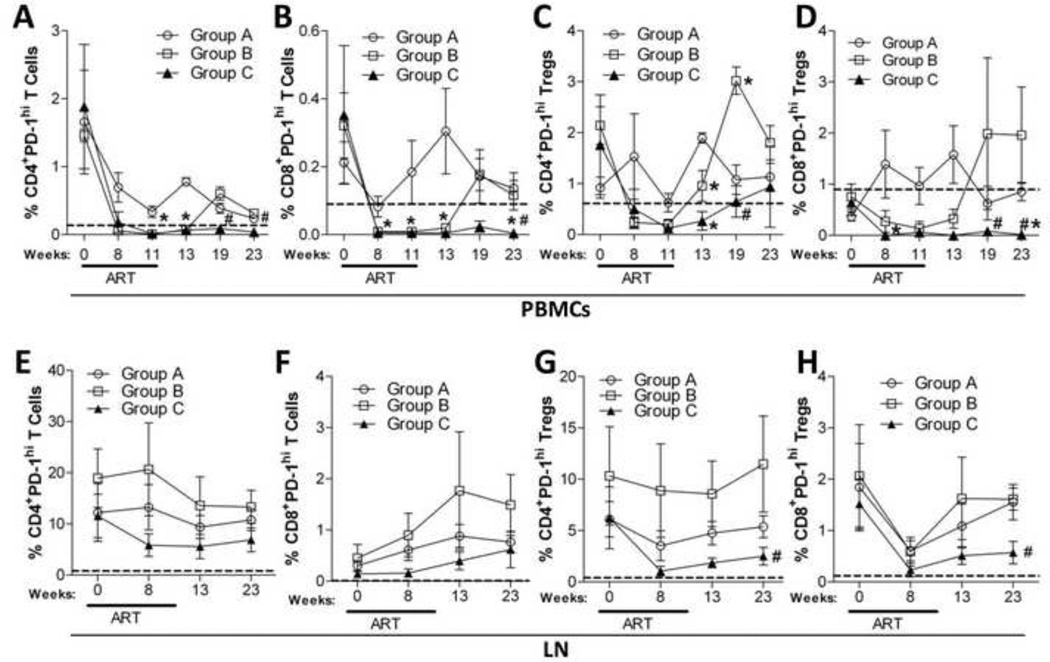
Figure 6. B7-DC-Ig treatment during and after ART significantly decreases the percentage of circulatory PD-1hi CD4+ and CD8+ T cells and Tregs.
PBMCs and LN cells were isolated at the indicated time points and stained for flow cytometric analysis of PD-1 expression. CD4+ (A and E) and CD8+ (B and F) PD-1hi T-cells, as well as, CD4+ (C and G) and CD8+ (D and H) PD-1hi Tregs were monitored for the duration of the study in PBMC (A–D) and LN (E–H). Dotted lines represent mean values of each cell population obtained from naïve macaques (10 for PBMCs and 5 for LN). Data are shown as means ± SEM. *, p<0.05 indicates statistically significant differences between Group A and Group B or C by the Mann-Whitney Test. #, p<0.05 indicates statistically significant differences between Group B and Group C by the Mann-Whitney Test.

