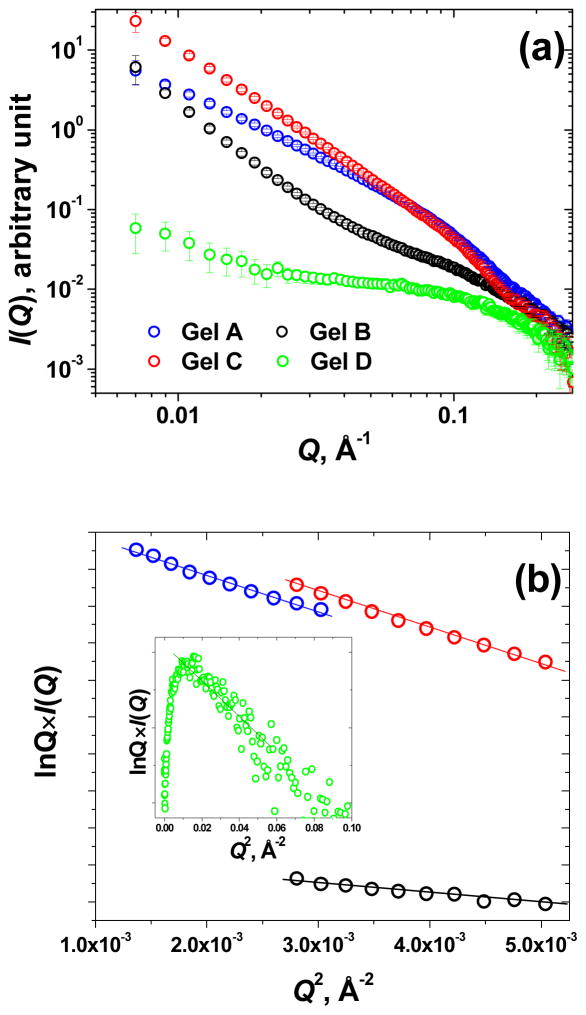
Figure 5.
(a) SAXS scattering profiles I(Q) vs. Q of Gels A–D after 72 hours of gelation; (b) Guinier plots for rod-like particles, lnQ×I(Q) vs. Q2, for Gels A–C, the inset shows the lnQ×I(Q) vs. Q2 plot for Gel D with the upturn characteristic for the finite length elongated assemblies. Gel A, Blue; Gel B, black; Gel C, red; Gel D, green.

