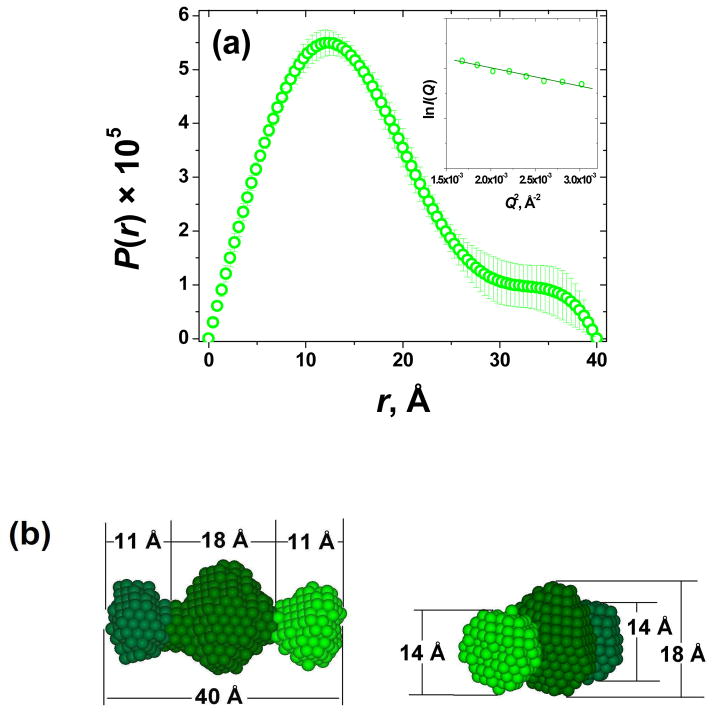
Figure 6.
(a) Pair-wise distance distribution function P(r) of Gel D (quality fit parameter of GNOM regularization ~0.7, for ideal fit it is 1.0); the inset shows the linear Guinier plot for globular particles, lnI(Q) vs. Q2; (b) Two projections of the average ab initio low resolution 3D model of finite size aggregates in Gel D, different shades of green were used only to better visualize the dimensions in different projections.

