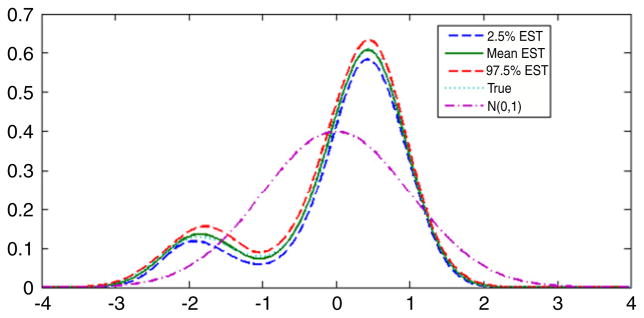
Fig. 5.

True and estimated latent variable densities for the simulation example. The dotted line is the posterior mean estimate, the solid line is the true density, and the dashed lines are 95% pointwise credible intervals.

True and estimated latent variable densities for the simulation example. The dotted line is the posterior mean estimate, the solid line is the true density, and the dashed lines are 95% pointwise credible intervals.