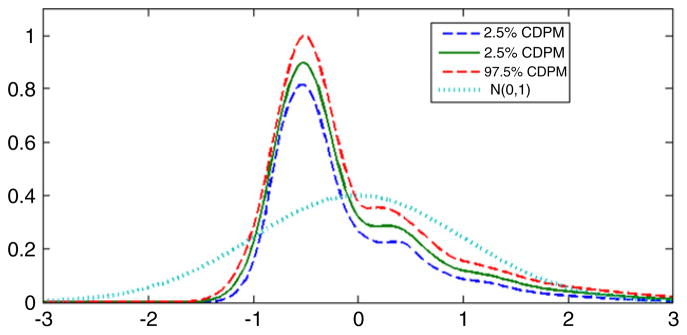
Fig. 7.

Estimated density of the latent DDT exposure variable in the DDT and premature birth application. The solid line is the posterior mean, the dashed lines are 95% pointwise credible intervals, and the dotted line is the standard normal density.
