Fig. 8.

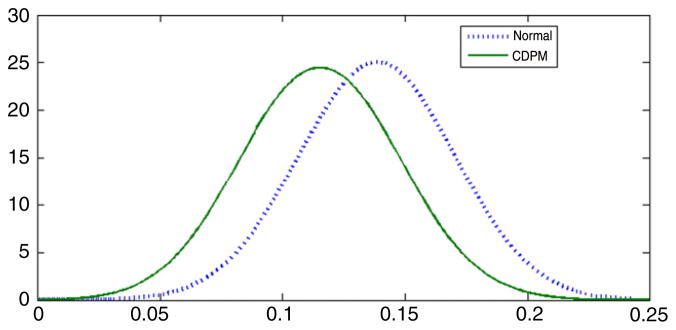
Estimated posterior densities for λy in the DDT and preterm birth application. The solid line is the estimate in the CDPM analysis, while the dotted line is the estimate for the normal latent variable model.

Estimated posterior densities for λy in the DDT and preterm birth application. The solid line is the estimate in the CDPM analysis, while the dotted line is the estimate for the normal latent variable model.