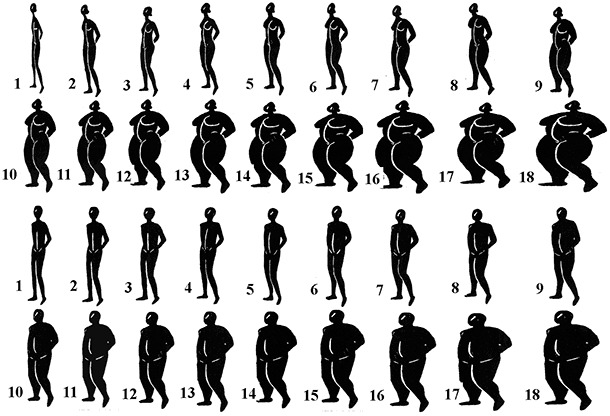
Figure 1.

Body image rating scale for men and women. Images 1 through 5 represent people who are underweight, images 6 through 9 represent people of normal weight, images 10 through 13 represent overweight people, and images 14 through18 represent obese people (11).
