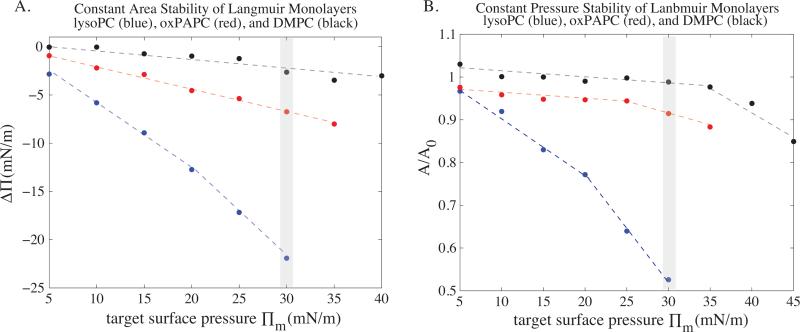
Fig. 3.
Constant area (A) and constant pressure (B) stability diagrams of lysoPC (blue), oxPAPC (red), and DMPC (black) at 37 °C. The y-axis in (A) represents the drop in pressure occurring over 1000 s beginning from the initial target surface pressure (Πm) to which the Langmuir monolayer was compressed before the monolayer was allowed to relax at constant area. DMPC is capable of maintaining target pressures to within a few mN/m far beyond bilayer equivalent pressures (shaded in gray is pressure where ). lysoPC monolayers are unstable at all pressures but become increasingly so as the target pressure increases. oxPAPC shows intermediate stability, being closer to DMPC than lysoPC. The constant pressure diagram (B) compiles the data presented (using A(t = endpoint)/A0) and shows a similar stability trend as the constant area plot: DMPC ≥ oxPAPC ≫ lysoPC. (For interpretation of the references to color in this figure legend, the reader is referred to the web version of the article.)

