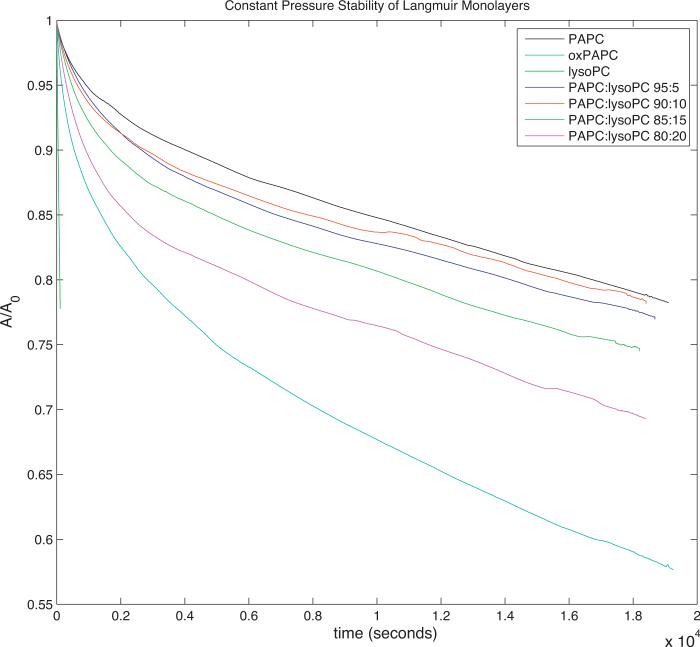
Fig. 4.
Constant pressure stability curves for Langmuir monolayers of PAPC, lysoPC, oxPAPC, and mixtures of PAPC and lysoPC at 37 °C under bilayer equivalence pressure (30 mN/m). Plotted are the normalized area per molecule (A/A0) as a function of time, where A0 = A(t = 0). The PAPC–lysoPC mixture curves maintain a consistent shape, except for an increasing offset in normalized area with the increasing concentration of lysoPC. The pure lysoPC stability curve is limited to short times due to the rapid solubilization of lysoPC from the interface as the membrane is compressed to the bilayer equivalence pressure.

