Fig. 7.
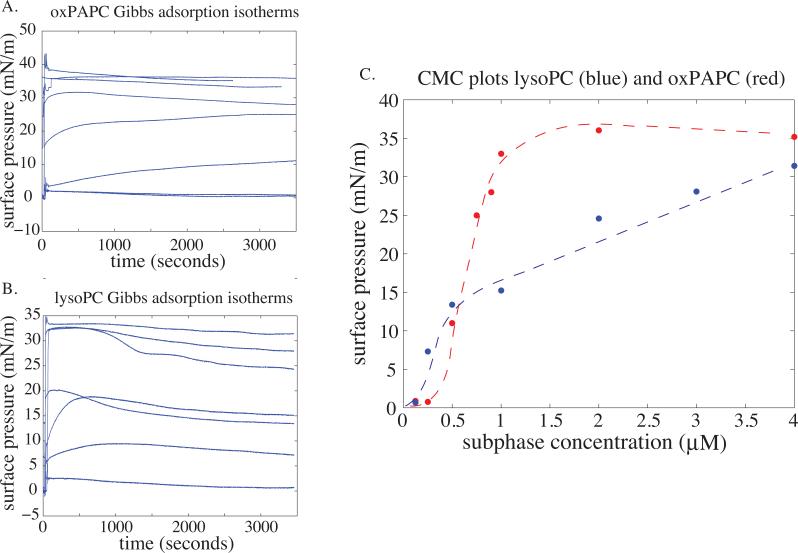
Gibbs adsorption isotherms at 37 °C for oxPAPC (A) with bulk concentrations of 0.125, 0.25, 0.5, 0.75, 0.9, 1.0, 2.0, and 4.0 μM (increasing final pressure with increasing bulk concentration); and, lysoPC (B) with bulk concentrations of 0.125, 0.25, 0.5, 1.0, 2.0, 3.0, and 4.0 μM. In (C), the final surface pressure (taken at the end of an hour) is plotted against the bulk lipid concentrations generating a critical micelle concentration diagram. oxPAPC behaves like a strongly surface active molecule with a sharp increase in surface pressure over a narrow concentration regime (0.5–1 μM); lysoPC shows a broader transition spanning several μM, which is indicative of poorly surface active molecules.

