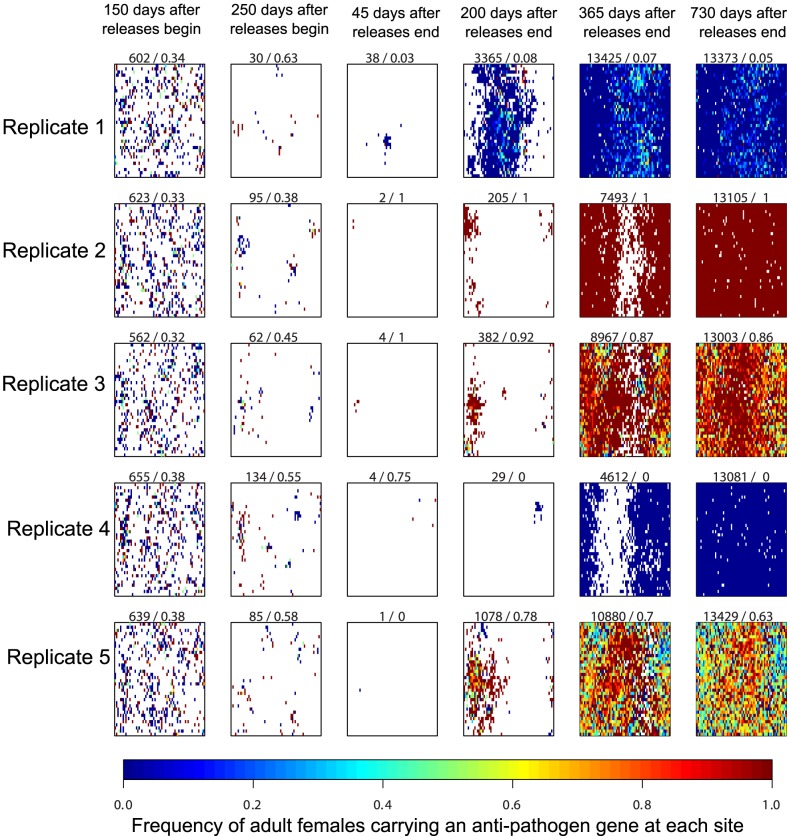
Figure 2. Illustrative examples of the genotypic dynamics of adult females through space and time.
Here, and in Figure 3, unlike the replicate simulations in Figures 1, 4, 5, 6 and 7, we simulate the model using the same spatial configuration of potential breeding sites across replicate model runs. Results are from a simulated weekly release of 12 males in all sites for a single year (approximately 1.5 million total transgenic mosquitoes released). Colors represent the frequency of female adults carrying the anti-pathogen gene at the site, from blue (wild-type only) through red (anti-pathogen gene is at fixation). The first number at the top of each panel represents the total number of adult females in the population at the corresponding date, and the second number describes the frequency of adult females carrying the anti-pathogen gene on that date. Adult females are absent at sites without a color (white region). The prominent roles played by demographic stochasticity, spatial structure, and genetic drift are apparent in the diverse trajectories of recovery.

