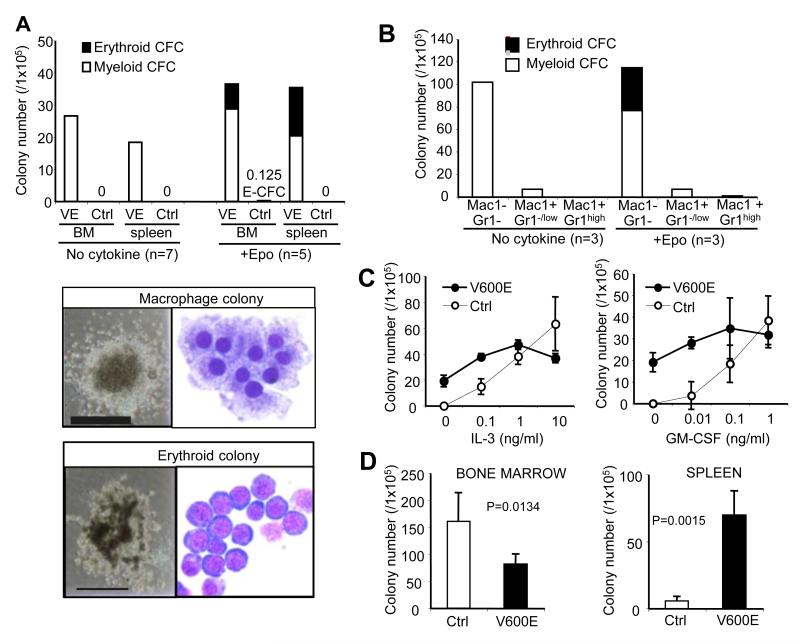
Figure 3. In vitro charactrerization of BRAFV600E hematopoietic progenitors.
A. (Top) myelo-erythroid colony formation of BRAFV600E (VE) and control (Ctrl) bone marrow and spleen cells in cytokine-free or Epo-added mechylcellulose cultures (average of 5-7 independent experiments). (Bottom) Representative images of the cytokine-independent macrophage colony (top) and the Epo-dependent erythroid colony (bottom). Phase-constrast microphotographs (shown at x40 original magnification, grid: 2mm) and Giemsa-staining of cytospin preparations (shown at x1000 original magnification) are indicated. B. Myelo-erythroid colony formation of the sorted Mac1−Gr1−, Mac1+Gr1−/low, and Mac1+Gr1high BRAFV600E bone marrow populations in cytokine-free or Epo-added mechylcellulose culture (average of 3 independent experiments). C. Myeloid colony development of control (Ctrl) and BRAFV600E (V600E) bone marrow cells in the presence of increasing concentrations of IL-3 (0.1-10ng/ml, left) or GM-CSF (0.01-1ng/ml, right). D. Myeloid colony numbers generated from 1×10⁵ bone marrow (left) or spleen (right) cells from BRAFV600E (V600E) or control (Ctrl) mice in the presence of IL-3 (10ng/ml), SCF (50ng/ml), EPO (4U/ml) and TPO (100ng/ml).

