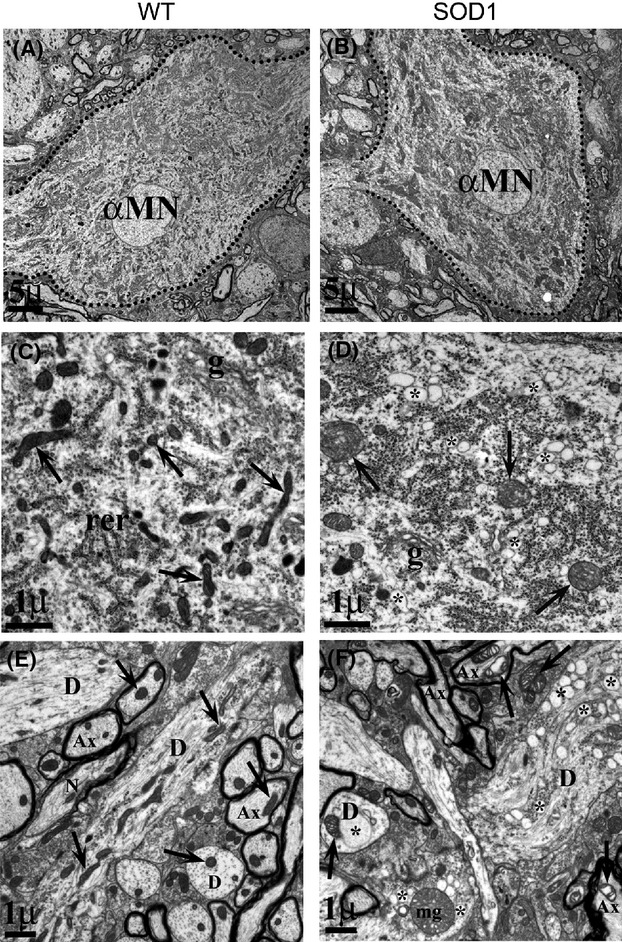
Figure 16.

Enlarged mitochondria and cytoplasmic vacuoles are observed in P30 SOD1 MNs. At P30, αMNs have a similar appearance in both WT (A) and SOD1 (B) animals. However, upon closer inspection, mitochondria (arrows in C–F) are larger in SOD1 (D) as compared with WT (C). There is also an accumulation of numerous small vacuoles in the cytoplasm of SOD1 MNs (* in D and F). In the neuropil, these effects are more striking, as seen in SOD1 (F) versus WT (E). Axons (Ax) and dendrites (D) contain quite swollen mitochondria (arrows) and larger, more numerous vacuoles (*), as well as mega-mitochondria (mg). We examined ultrastructural changes in MNs in the L3–L4 segments of the spinal cord at day 30 of SOD1G93A mice (n = 5, total of 38 MNs) and compared these findings with age-matched wild-type (WT) animals (n = 5, total of 48 MNs).
