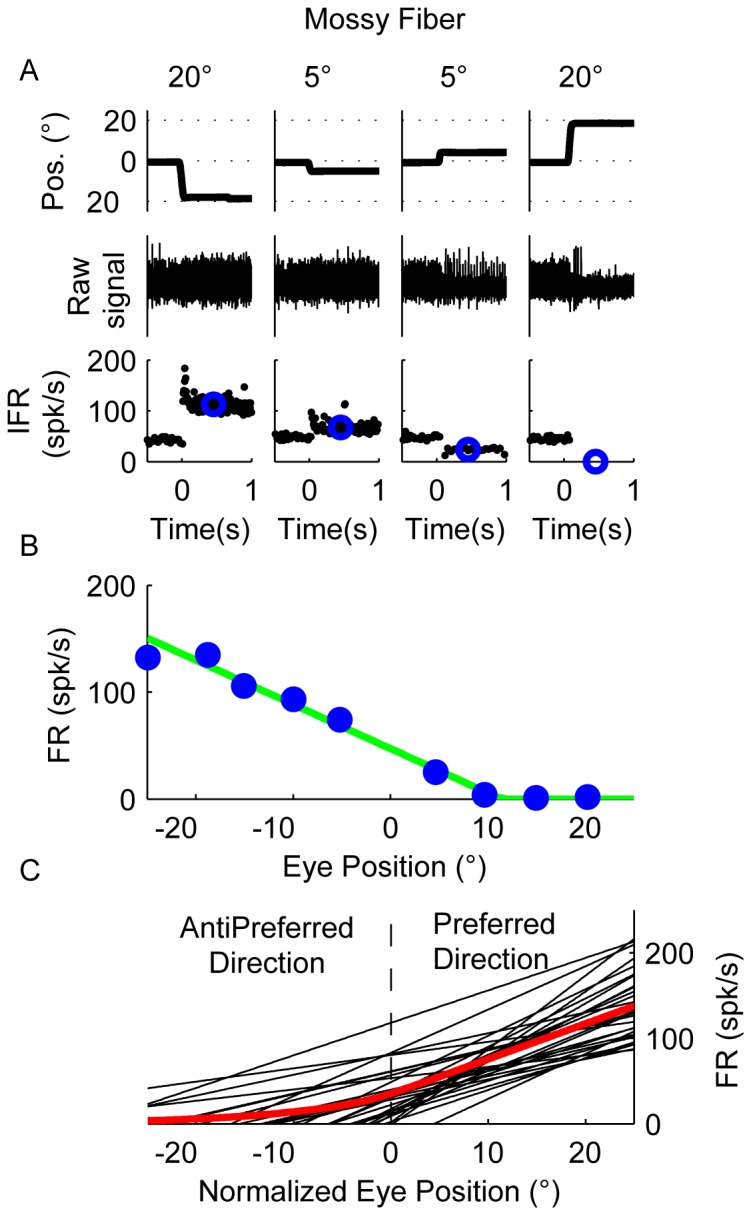
Figure 2. Responses of mossy fibers.

(A) Raw data showing the response of an example mossy fiber to 5 deg and 20 deg leftward and rightward off-center fixation trials. The upper row shows horizontal eye position (negative values for leftward eye position and positive for rightward eye position), the middle raw spike data, and the bottom row instantaneous firing rate (IFR, black dots). Blue circles in the lower row represent the average firing rate following each saccade (200–700 ms). (B) Relationship between average firing rate and eye position using data from trials like those shown in A. (C) Best fitting line for each mossy fiber that could be well fit with F1, showing the relationship between eye position and firing rate. The eye position has been normalized to display the preferred direction of the neuron as positive. The average response profile across all mossy fibers is shown in red.
