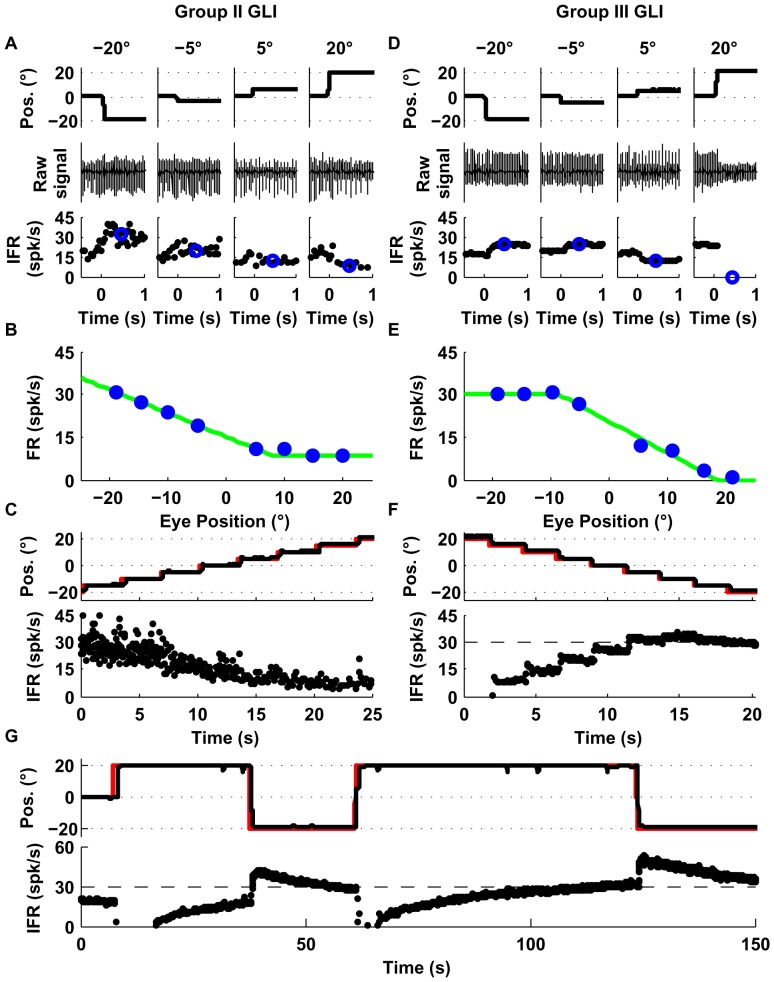
Figure 4. Responses of example Group II (A–C) and III (D-G) GLIs.
(A, D) The upper row shows horizontal eye position, the middle raw spike data, and the bottom row instantaneous firing rate (IFR). Blue circles in the lower row represent the average firing rate following each saccade (200–700 ms). (B, E) Relationship between average firing rate and eye position using data from trials like those shown in A and D. Both cells were fit with the function F2. The corresponding fits are shown as green lines in B and E. (C, F) Response of the each example neuron during sequential saccades (5 deg). The upper row shows in black traces the eye position and in red traces the laser position; the lower row shows the instantaneous firing rate (IFR). (G) Response of the example Group III GLI shown in D–F during long eye fixations. The upper row shows in black traces the eye position and in red traces the laser position, the lower row shows the instantaneous firing rate (IFR).

