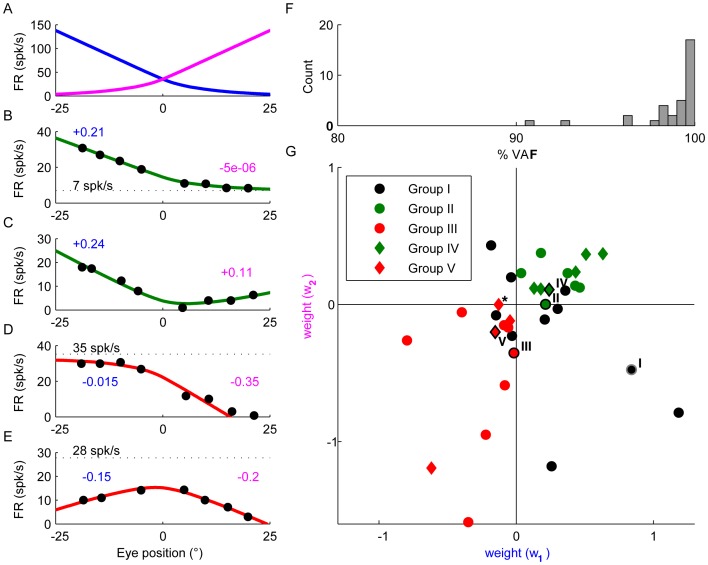
Figure 6. Modeling the responses of GLIs.
(A) Average response profile of mossy fibers, identical to the red line in Figure 2C, but shown as two different tuning curves with opposite directional preferences for illustration of the fitting approach. (B–E) Model fits of the response profiles of the example Group II (B), IV (C), III (D) and V (E) GLIs. The weights w1 and w2 used for the fits are indicated in blue and magenta. The offsets FR0 are indicated by black broken lines (in C, the offset is negative). (F) Distribution of VAFs produced by the model across the population of GLIs. (G) Scatter plots showing the weights obtained by model fitting. The example Group I–V GLIs shown in Figure 3–5 are plotted with black (group II–V) and gray (group I) borders and with roman numbers to the left indicating the GLI group they belong to. The asterisk indicates a group V GLI with a w2/w1 ratio near zero (the response profile of this GLI is shown in Figure S3). This cell was atypical among group IV and V GLIs because, unlike the rest of group IV and V GLIs whose responses were best fit by two slopes of opposite sign (i.e., direction), the slopes of the two lines that best fit the response of this cell had the same direction.

