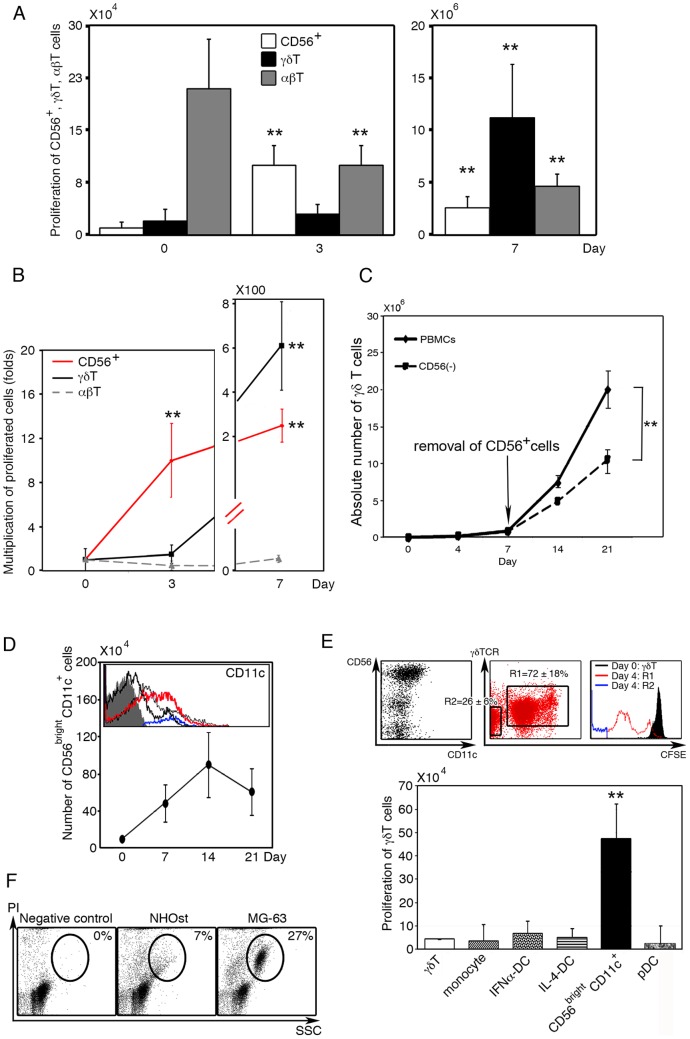
Figure 1. Development, change of phenotype and function of CD56brightCD11c+ cells induced by IL-18.
(A) Time course of the development of CD56brightCD11c+ cells. PBMCs (1×10⁵ cells/0.5 ml/well) were stimulated with ZOL/IL-2/IL-18. The absolute numbers of CD56+ or CD56brightCD11c+ cells (white bar), γδ T cells (black bar) and αβ T cells (gray bar) were determined by flow cytometry and trypan blue dye exclusion test at day 0, day 3 (left), and day 7 (right). Data show mean ± SD (n = 10), **p<0.01. (B) Proliferation of CD56+ or CD56brightCD11c+ cells (red line), γδ T cells (black line), and αβ T cells (gray line). Data show mean ± SD (n = 10), **p<0.01. (C) Requirement of CD56brightCD11c+ cells for maximal sustained proliferation of γδ T cells. PBMCs were pre-stimulated with ZOL/IL-2/IL-18, and harvested on day 7. The proliferating cells were divided into 2 groups: one group was incubated with anti-CD56 antibody-conjugated beads and CD56+ cells were selectively removed. The other group was incubated with mouse IgG1-conjugated beads and used as a control. Both groups were re-incubated with ZOL/IL-2/IL-18 for another 14 days. Data show mean ± SD (n = 5), **p<0.01. (D) Development of CD56brightCD11c+cells and gradual reduced expression of CD11c. The number and CD11c expression of proliferated cells were analyzed by flow cytometry during the culture of CD3+ T cell-depleted PBMCs. (Grey shadow: isotype control; blue: CD56intCD11c+cells on day 0; red: CD56brightCD11c+cells on day 7; thin black line: day 14; and bold black line: day 21). Data show mean ± SD (n = 5). A histogram shown is a representative of five independent experiments. (E) Comparison among CD56brightCD11c+ cells, monocytes, and several subsets of DCs in helper activity for γδ T cells proliferation. Freshly isolated γδ T cells(5×10⁴/well) were labeled with CFSE and co-cultured for 7 days with fresh CD14+ monocytes, IFN-α-DCs, IL-4-DCs, CD56brightCD11c+, or pDCs, at a ratio of 1∶1 in the presence of ZOL/IL-2/IL-18. Then, proliferative responses of γδ T cells were analyzed based on flow cytometry and trypan blue dye exclusion test. R1: γδ T cells labeled with CFSE undergoing cell division; R2: Unlabeled CD56brightCD11c+ cells. Data show mean ± SD (n = 5), **p<0.01. The result is representative of five independent experiments. (F) Differential cytotoxicity of CD56brightCD11c+ cells against normal osteoblast cells (NHOst) and tumor cells (MG-63). The cytotoxicity was assessed using standard propidium iodide staining. Dot plots shown are representative of three independent experiments.

