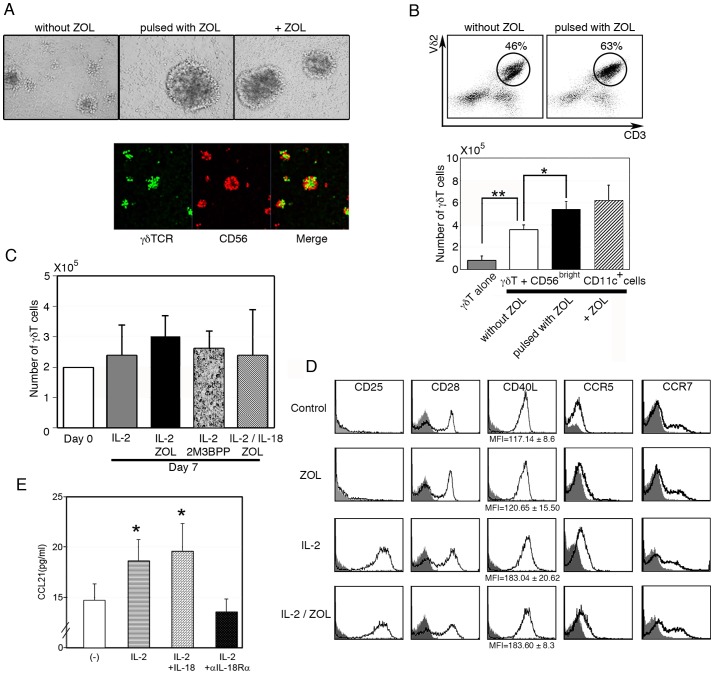
Figure 2. Interaction between γδ T cells and CD56brightCD11c+cells.
(A) Cell aggregates observed in culture of γδ T cells mixed with CD56brightCD11c+ cells without pulse (left), pulsed with ZOL (center), and further incubated with ZOL (right) (upper panels) and confocal microscopic observation of the culture of γδ T cells (green) and CD56brightCD11c+ cells (red) in the presence of ZOL (lower panels). Data shown are representative of three independent experiments. (B) Flow cytometric analysis of γδ T cells incubated with CD56brightCD11c+ cells (upper panels) and the numbers of γδ T cells after expansion for 7 days (lower panel). Dot plots shown are representative of three independent experiments, and data of cell counts show mean ± SD (n = 5), *p<0.05, **p<0.01. (C) There was no sustained proliferation of freshly isolated γδ T cells in the absence of accessory cells even after stimulation with IL-2, IL-2/ZOL, IL-2/IL-18/ZOL, or IL-2/2M3B1PP for 7 days. Data show the mean ± SD (n = 5). (D) Expression of co-stimulatory molecules and chemokine receptors on γδ T cells after culture with ZOL, IL-2, or ZOL/IL-2 for day 7. The result of flow cytometric analysis is representative of three independent experiments. (E) Induction of CCL21 by IL-18 in CD56brightCD11c+cells. CCL21 concentration in the culture supernatant at 7 days was measured by ELISA. Data show mean ± SD (n = 5), *p<0.05.

