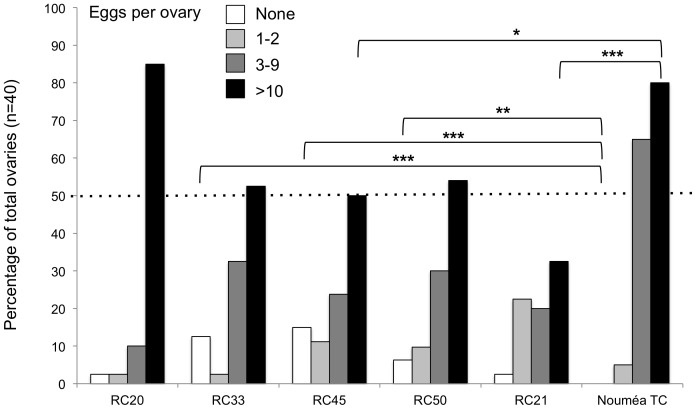
Figure 2. Ovary screen in trans-infected RC lines.
Size of ovaries was compared on basis of number of mature eggs in one ovary. Bars represent ovary size per line determined for each ovary class: white is class I with no mature eggs; light grey class II (1–2 eggs); dark grey class III (3–9 eggs); and black is class IV with 10 or more eggs. Y-axis shows percent of ovaries per class; x-axis shows RC lines plus the Wolbachia-unifected D. simulans Nouméa TC control. Significances based on two-tailed P values from Fisher's exact test are indicated by asterisks.

