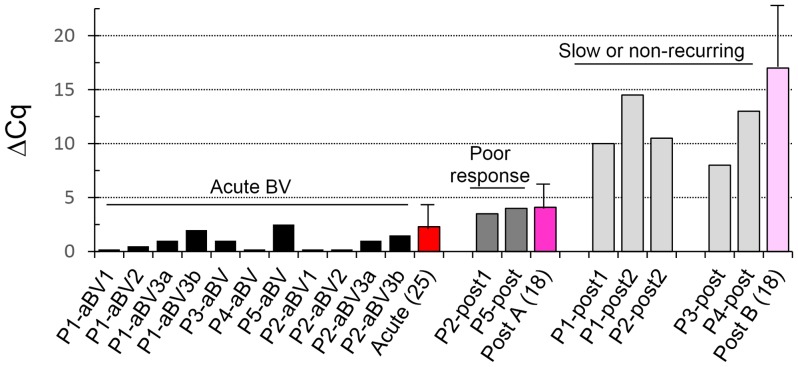
Figure 2. ΔCq values in samples from RBV patients at visit 1 (acute BV, black bars) versus post-treatment visit 2 (grey bars).
Patients who recurred rapidly recurring or responded poorly responding (P2, P5) are shown in dark grey; patients who did not recur or did so slowly are in light grey (P1, P2 after her 2nd recurrence, P3, P4). Red to pink bars represent averages of a separate collection of patients (numbers in parentheses) who were only sampled at the initial acute BV and/or the post-treatment visits, with indicated standard deviations.

