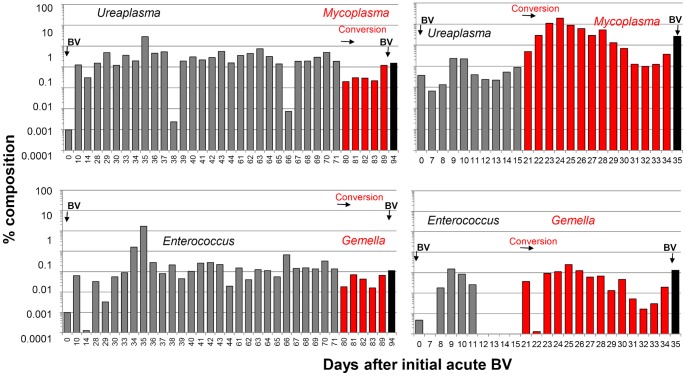
Figure 5. Shifts in dominant species common to conversions in P1 and P2.
Panels represent qPCR data using Mycoplasmatales primers (top) or Enterococcus primers (bottom). Amplicons were sequenced to identify species, or in some cases were identified by their distinguishing melt curves that matched those of the sequenced products.

