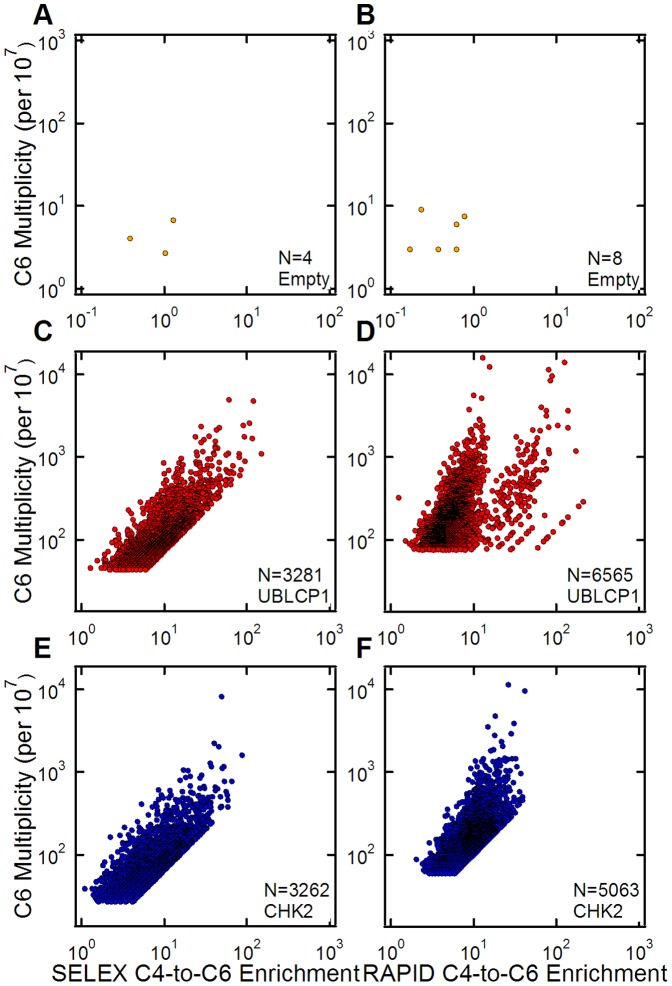
Figure 4. The relationship between sequence multiplicity and enrichment.
(A and B) Scatter plots of sequences’ multiplicity and enrichment within the top 10,000 highest multiplicity sequences from Cycle 6 of SELEX and RAPID for the Empty microcolumns. Multiplicity values have been normalized to counts per 107 and enrichment is calculated as the ratio of Cycle 6 multiplicities to Cycle 4 multiplicities for any sequence found in both pools. Some data points are obscured due to overlapping values. (C and D) Scatter plots of sequences’ multiplicity and Cycle 4-to-Cycle 6 enrichment within the top 10,000 highest multiplicity sequences from Cycle 6 of UBLCP1 SELEX and RAPID. (E and F) Scatter plots of sequences’ multiplicity and enrichment within the top 10,000 highest multiplicity sequences from Cycle 6 of CHK2 SELEX and RAPID. RAPID sequences show significantly higher multiplicities at lower enrichments than SELEX.

