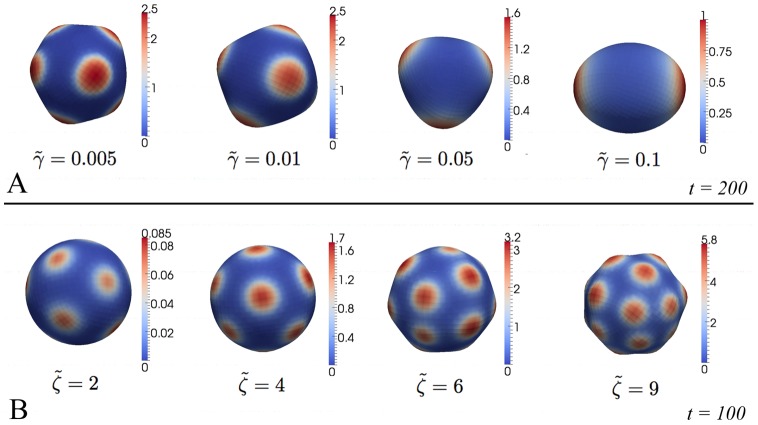
Figure 3. Influence of different model parameters on patterns.
A: Increasing diffusion by changing  results in bigger morphogen patches. B–C: An increase of coupling between tissue curvature and morphogen expression via
  (B) results in more but still equally sized patches. In all simulations red and blue color depict high and low morphogen levels, respectively.

