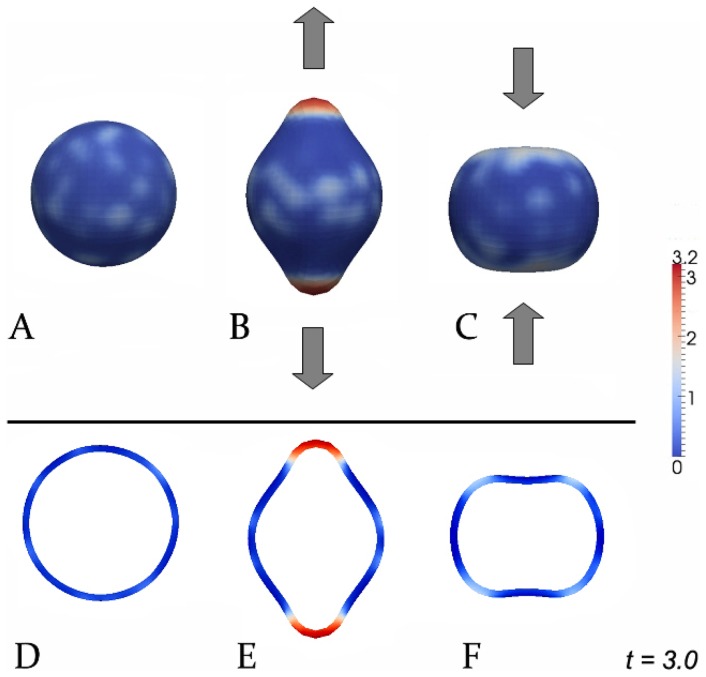
Figure 4. Possible experiments to prove the influence of tissue deformations on morphogen patterns.
A–C: 3D-simulations, D–F: corresponding cross-sections. A,D: Wildtype; B,E: pulling outwards; C,F: pressing inwards. In all simulations red and blue color depict high and low morphogen levels, respectively.

