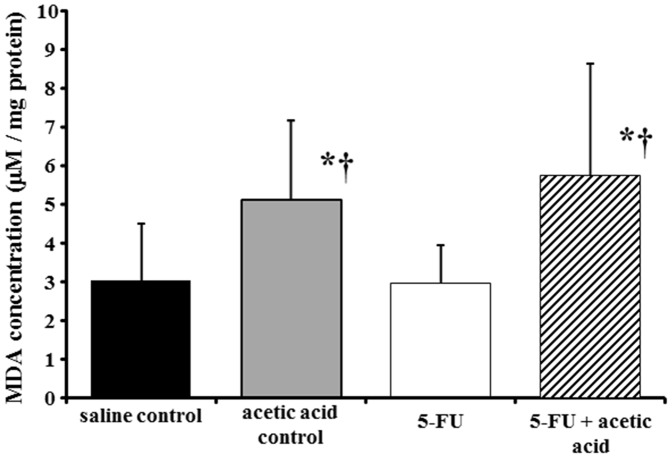
Figure 4. Malondialdehyde (MDA) concentration in the isolated cheek pouch with oral mucositis.
MDA concentration was assessed by TBARS assay and normalized by the amount of protein. The data are expressed as mean ± SD in all groups (n = 8–11). Statistical analysis was conducted using Tukey’s method. Experimental conditions are described in Materials and Methods. *P<0.05 vs. saline control, †P<0.05 vs. 5-FU.

