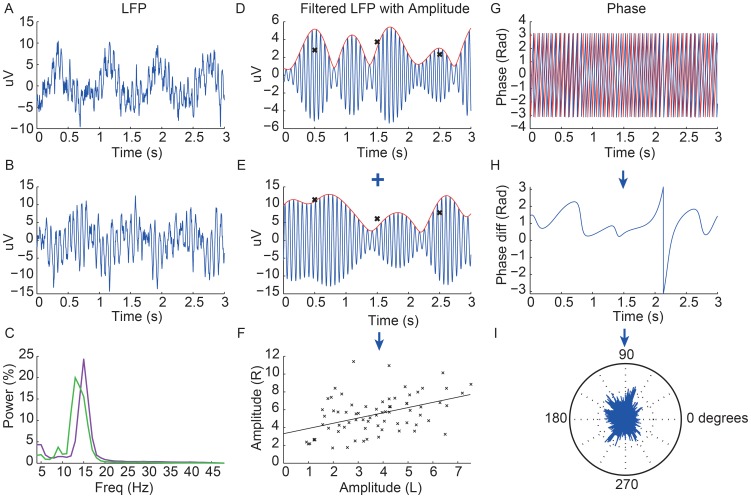
Figure 1. Data from one subject off levodopa showing LFPs with extracted amplitude and phase.
The first column shows 3(A = left STN, B = right STN) and their respective power spectra (C; left STN - purple, right STN - green). The second column shows the LFP pass-band filtered around the corresponding beta peak (blue) of each STN (D = left STN, E = right STN) with the amplitude shown in red. The crosses show the average amplitude for each 1 second window and the final graph shows the correlation of these 1 s average amplitudes across the two sides over 74 s duration record, with a linear regression line through them (F). The r value of this linear regression line is taken as the value of the amplitude co-modulation for any given subject. In this example r = 0.57, p<0.001. The right column shows the superimposed phase of the two LFP signals (red = left STN and blue = right STN) over 3 s (G) with the phase difference over this period shown below (H). A rose plot underneath shows the proportion of phase difference vectors at all points for the whole recording around the unit circle (I). The length of the average of these vectors is then taken as the value of the phase locking value (PLV), which in this case was 0.22. Note low frequency oscillations at about 1 Hz likely to be cardiac pulse artefact in A and B. Despite this, modulations in the amplitude envelopes of the beta band filtered LFP activity shown in D and E are not time-locked to the low frequency cardiac pulse artifacts in 1A and B.

